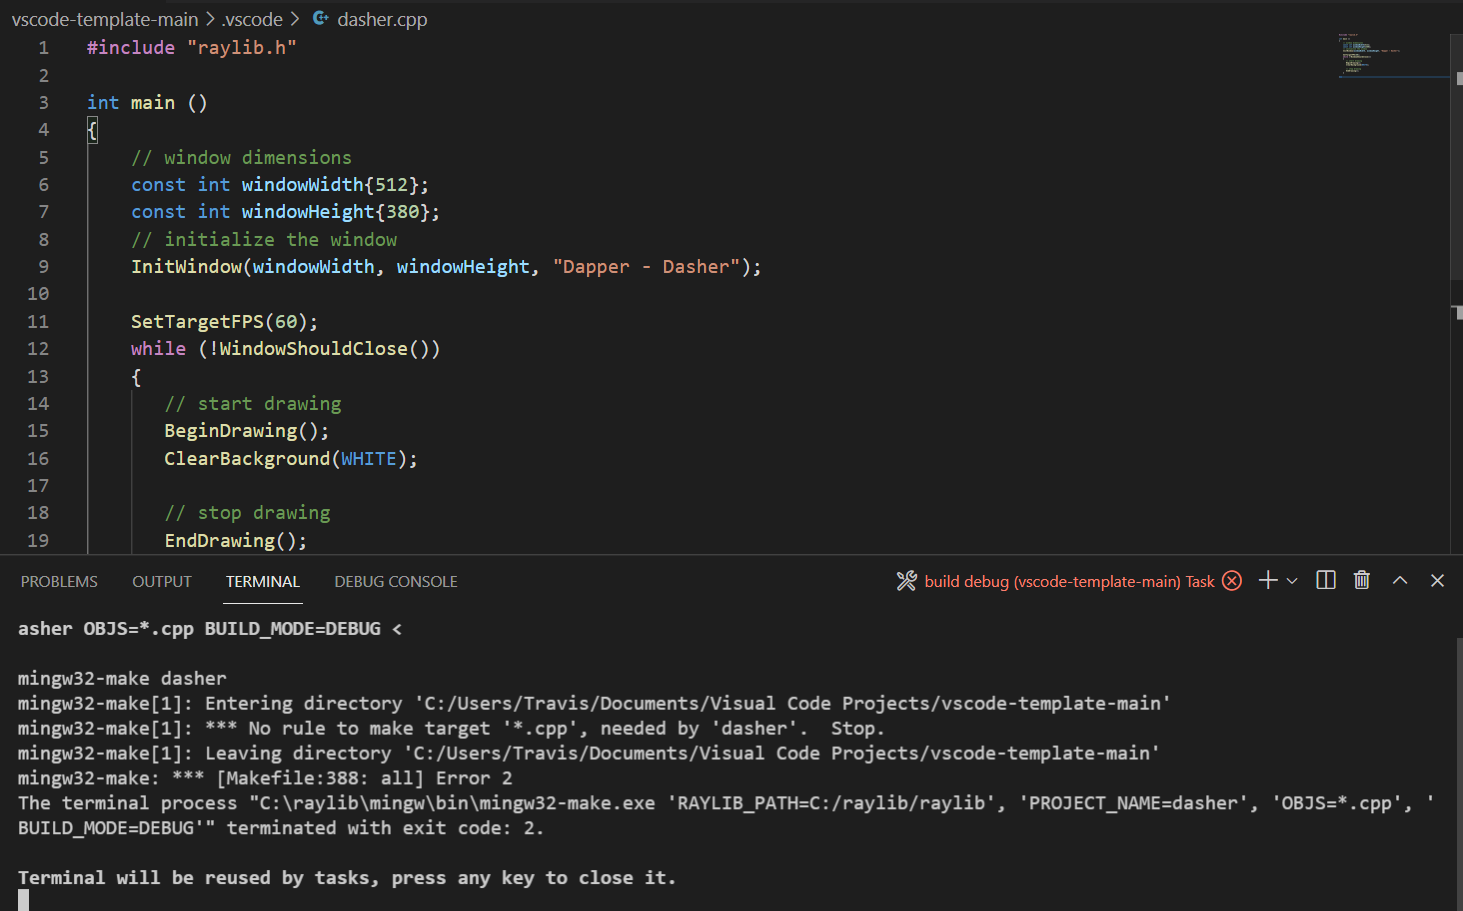
So I’m in the Dapper Dasher section of the course and I’m running into an issue. I typed the code out to create an external popup window but when I save and run the debugging tool the window isn’t generating. I’ve double-checked all my code and its nearly identical to the instructor’s. I followed all the steps to create a clone of the vscode-template, created the .cpp file, literally everything is exactly the same, but my window isn’t opening when I press debug. The code is working though because I used the terminal to run the ./dasher command and my window opens fine.
Can someone help me fix this, I like running from the debugger as it helps me follow what the code is doing.
This solution worked for me, I’m not sure exactly what happened though to make it stop working. You mentioned it was the wrong debugger, is that the debugger that is like built-in to the Raylib stuff? I’d be curious how they figured it out for future reference on stuff like this.
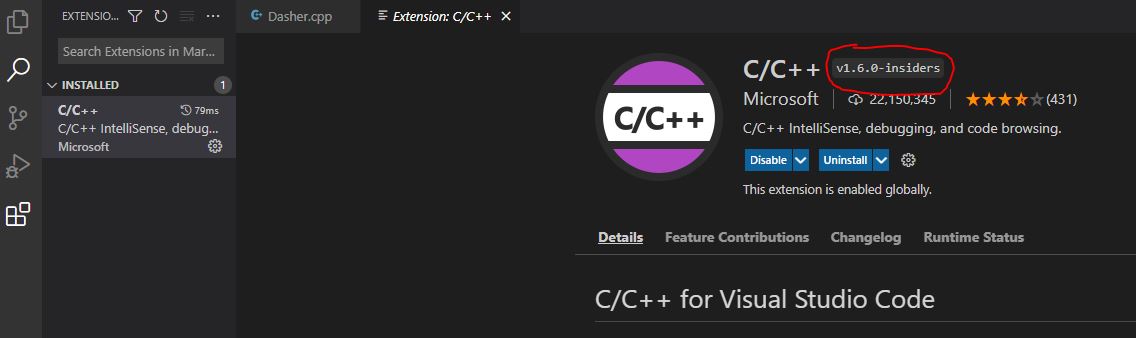
@Chasech I don’t believe it has any thing to do with Raylib. The article I linked is part of the VSCode Github group and mention that a lot others experiencing the same problem after updating C++ extension. I think there is issue with the installation of C++ 1.6.0
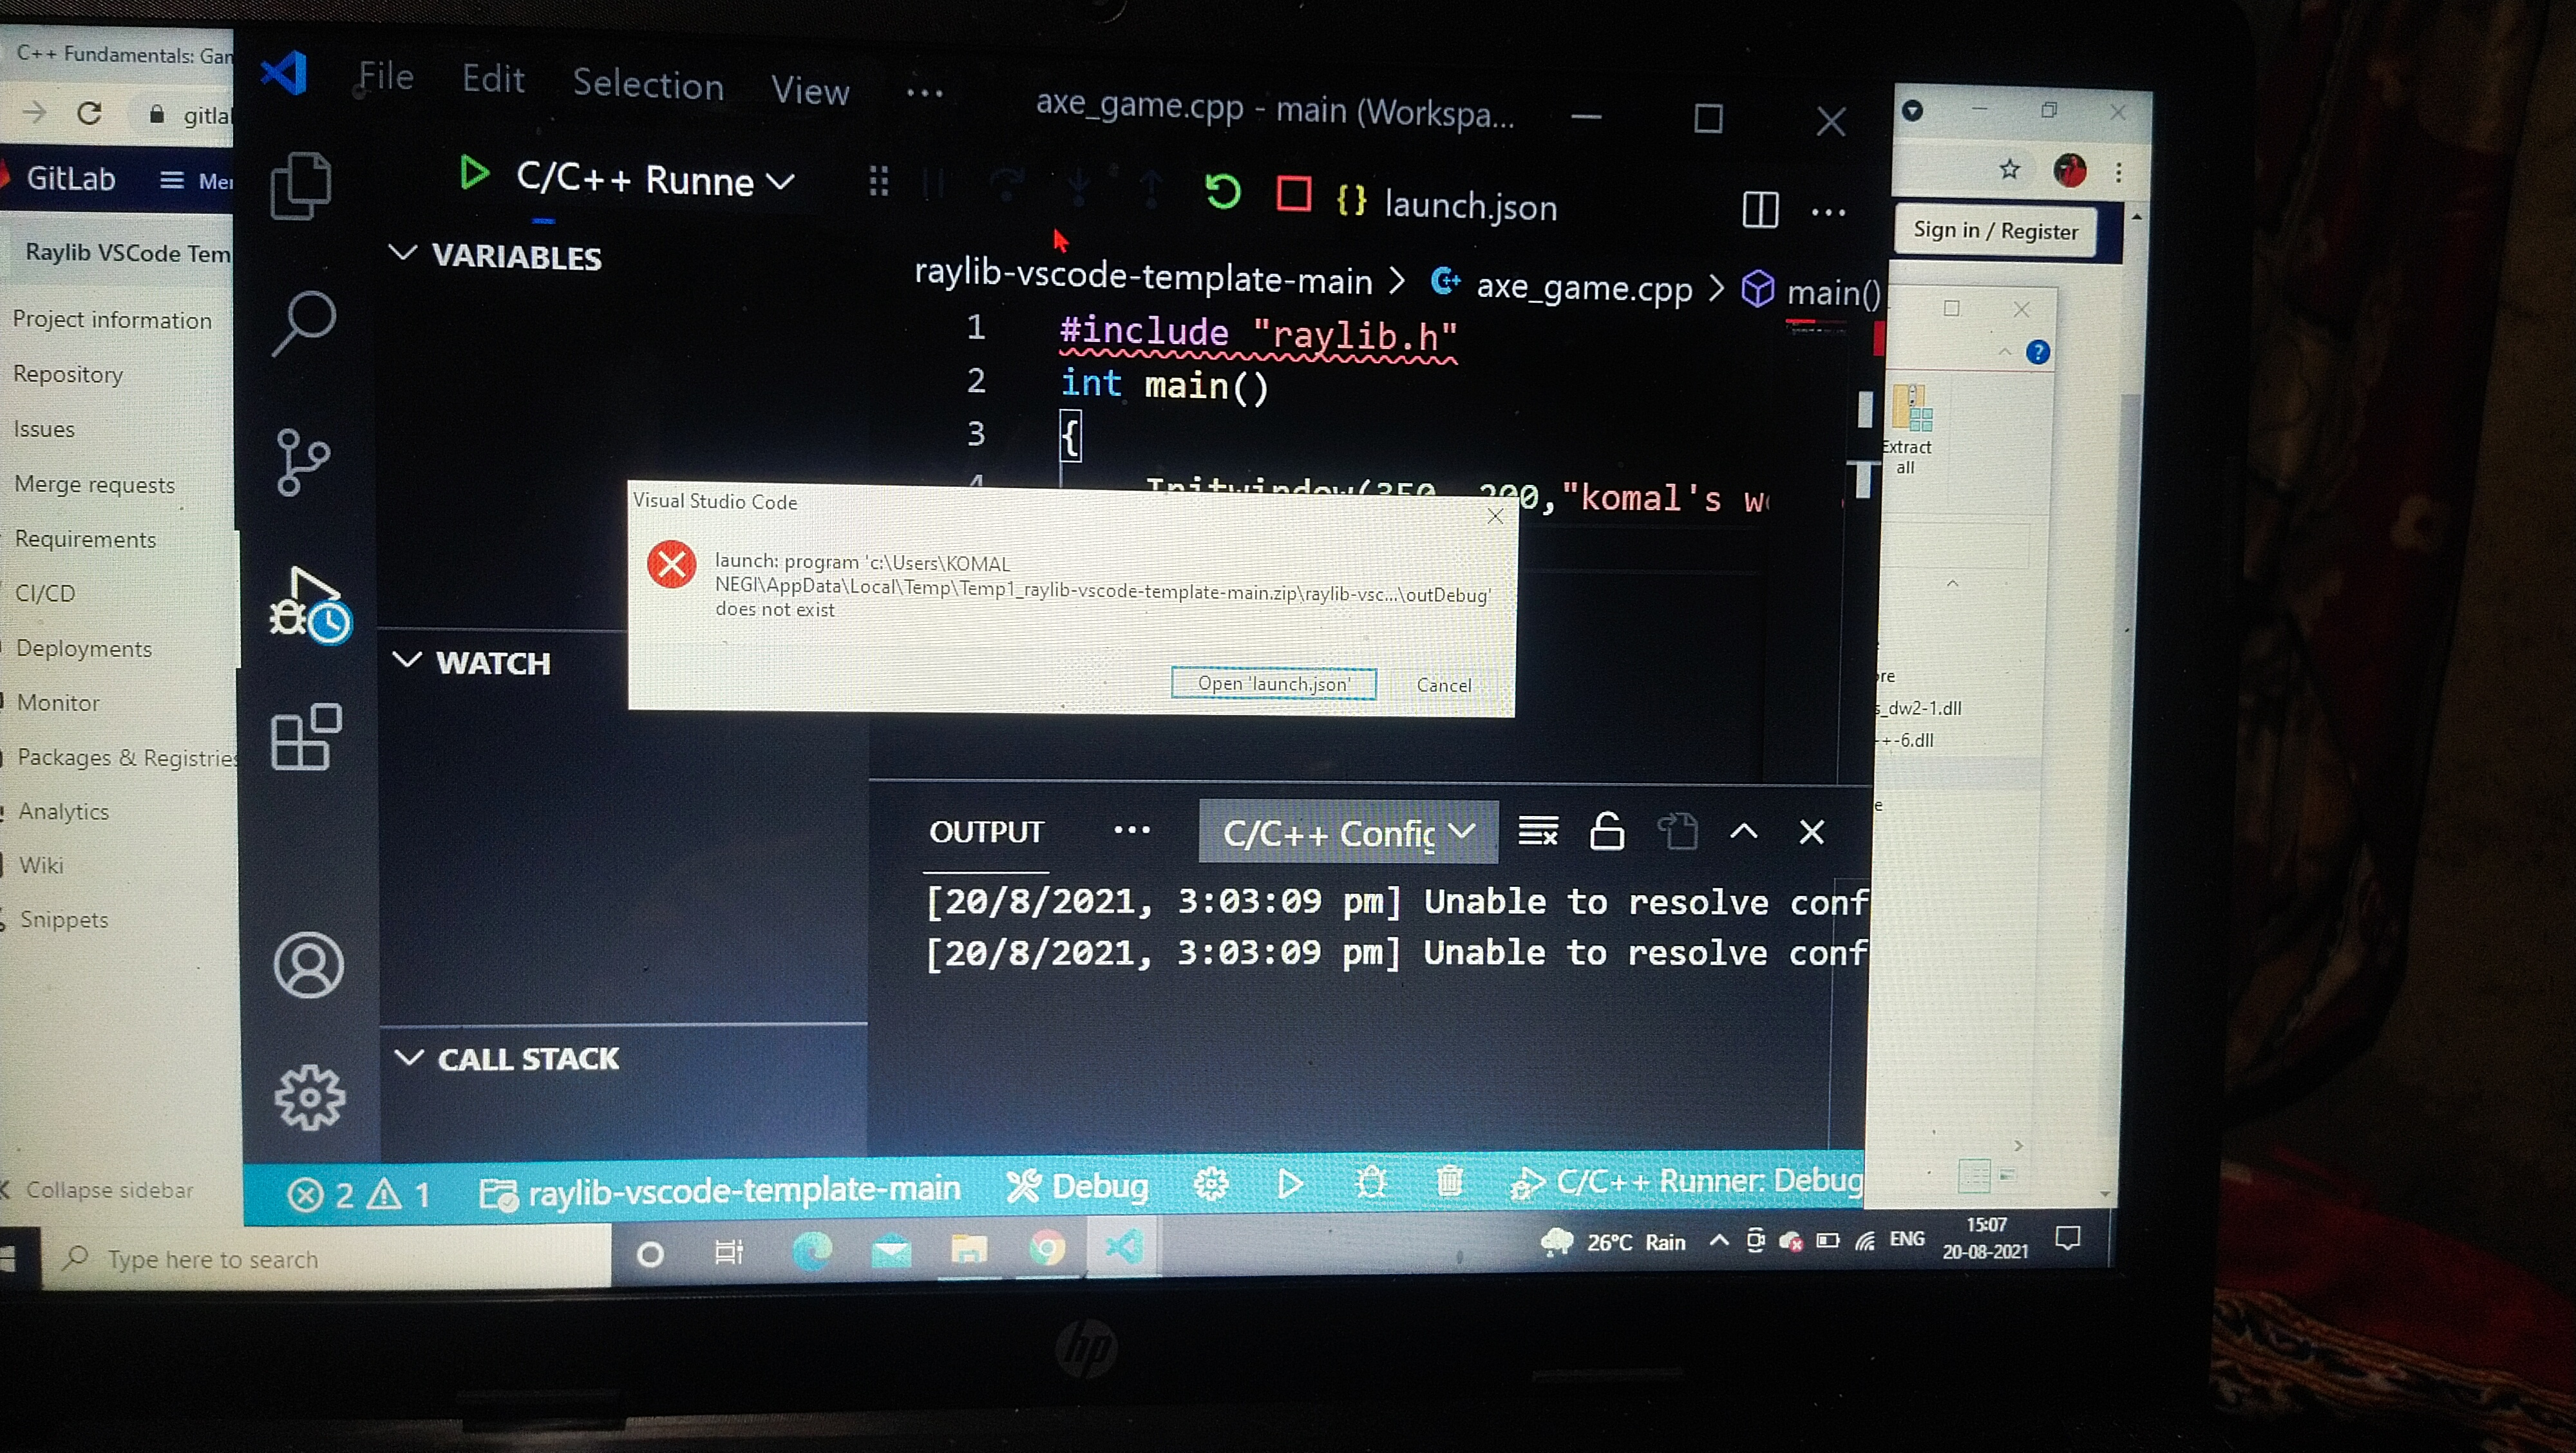
I tried the article you linked, sadly didn’t work. However, I think I might be getting a different issue.
Any suggestions? (restarted both VS code and my machine multiple times).
1. %USERPROFILE%.vscode\extensions\ms-vscode.cpptools-1.6.0-insiders\install.lock 2. %USERPROFILE%.vscode\extensions\ms-vscode.cpptools-1.6.0-insiders\debugAdapters
and deleted both of these files
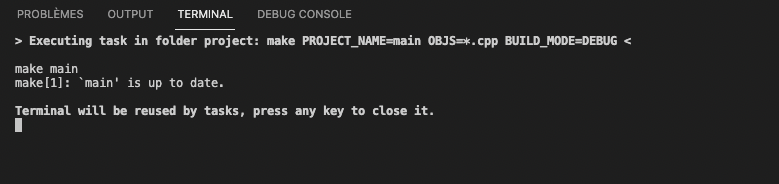
I’m facing the same issue with macOS.
the program run fine when I launch it normaly but with Debug Mode, even If I put some break points, it doesn’t care and just build the program and stop debugging. Is there any workaround for macOS ?
I can’t find it in the thread posted above.
EDIT : I tried to downgrade VS Code to 1.57 and Installed the 1.51 C++ Extension and I have a different behavor with the following error:
Warning: Debuggee TargetArchitecture not detected, assuming x86_64.
ERROR: Unable to start debugging. Unexpected LLDB output from command "-exec-run". process exited with status -1 (attach failed ((os/kern) invalid argument))
The program '/Users/zoltan/Documents/GameDev/project/main' has exited with code 42 (0x0000002a).
I would recommend that you put through a screenshot of what the error is, even copy and past the error from the terminal. It could be you might have the wrong template or there is error in the template itself.
I have already post the error message from the version 1.57 above. With the version 1.59 I have no error message at all, It compile and then don’t run anything in debug mode.
That is still mentioning the zip and a temp folder implying it’s not extracted. Are you sure you extracted the zip and then opened the workspace in the extracted folder?