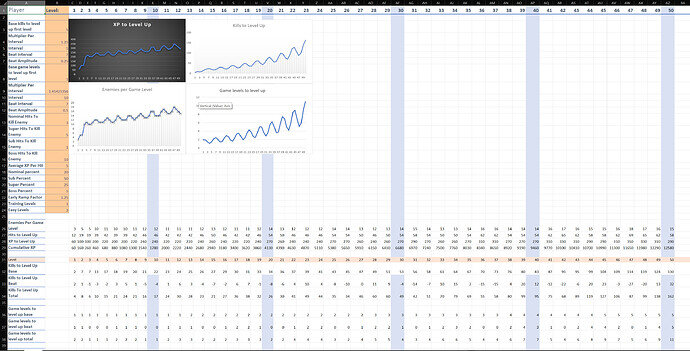
inputs are the column B in peach. To the right of that are graphs of four of the output rows.
Column A is the labels for each row. Rows 26 through 38 are output rows.
Note that not only did I use an exponential growth for various stats, I added a sine wave “beat” to them so there would be a rhythm of the stats. Hence separate inputs for "interval"s and "beat interval"s.
The main output I was interested in was Enemies Per Game Level. I added some “early installment weirdness” to it, start very low, ramp up fast to normal, then follow the slow-growing exponential with beats.
Sample formulas form Column D:
Row 26: =CEILING.MATH(D34/D38)
Row 27: =D26*($B18/100*$B13 + $B19/100*$B14 + $B20/100*$B15+$B21/100*$B16)
Row 28: =CEILING.MATH(D27*$B17/10)*10
Row 29: =C29+D28
Row 32: =IF(D31>$B23,IF(D31>$B24,$B3*$B4^((D31-1-$B23)/$B5)*($B22^(MIN(D31,5))),7), 2)
Row 33: =D32*(SIN(360*D31/$B6))*$B7
Row 34: =D32+D33
Row 36: =$B8*$B9^((D31-1)/$B10)
Row 37: =D36*(1+SIN(360*D31/$B11))*$B12
Row 38: =D36+D37


