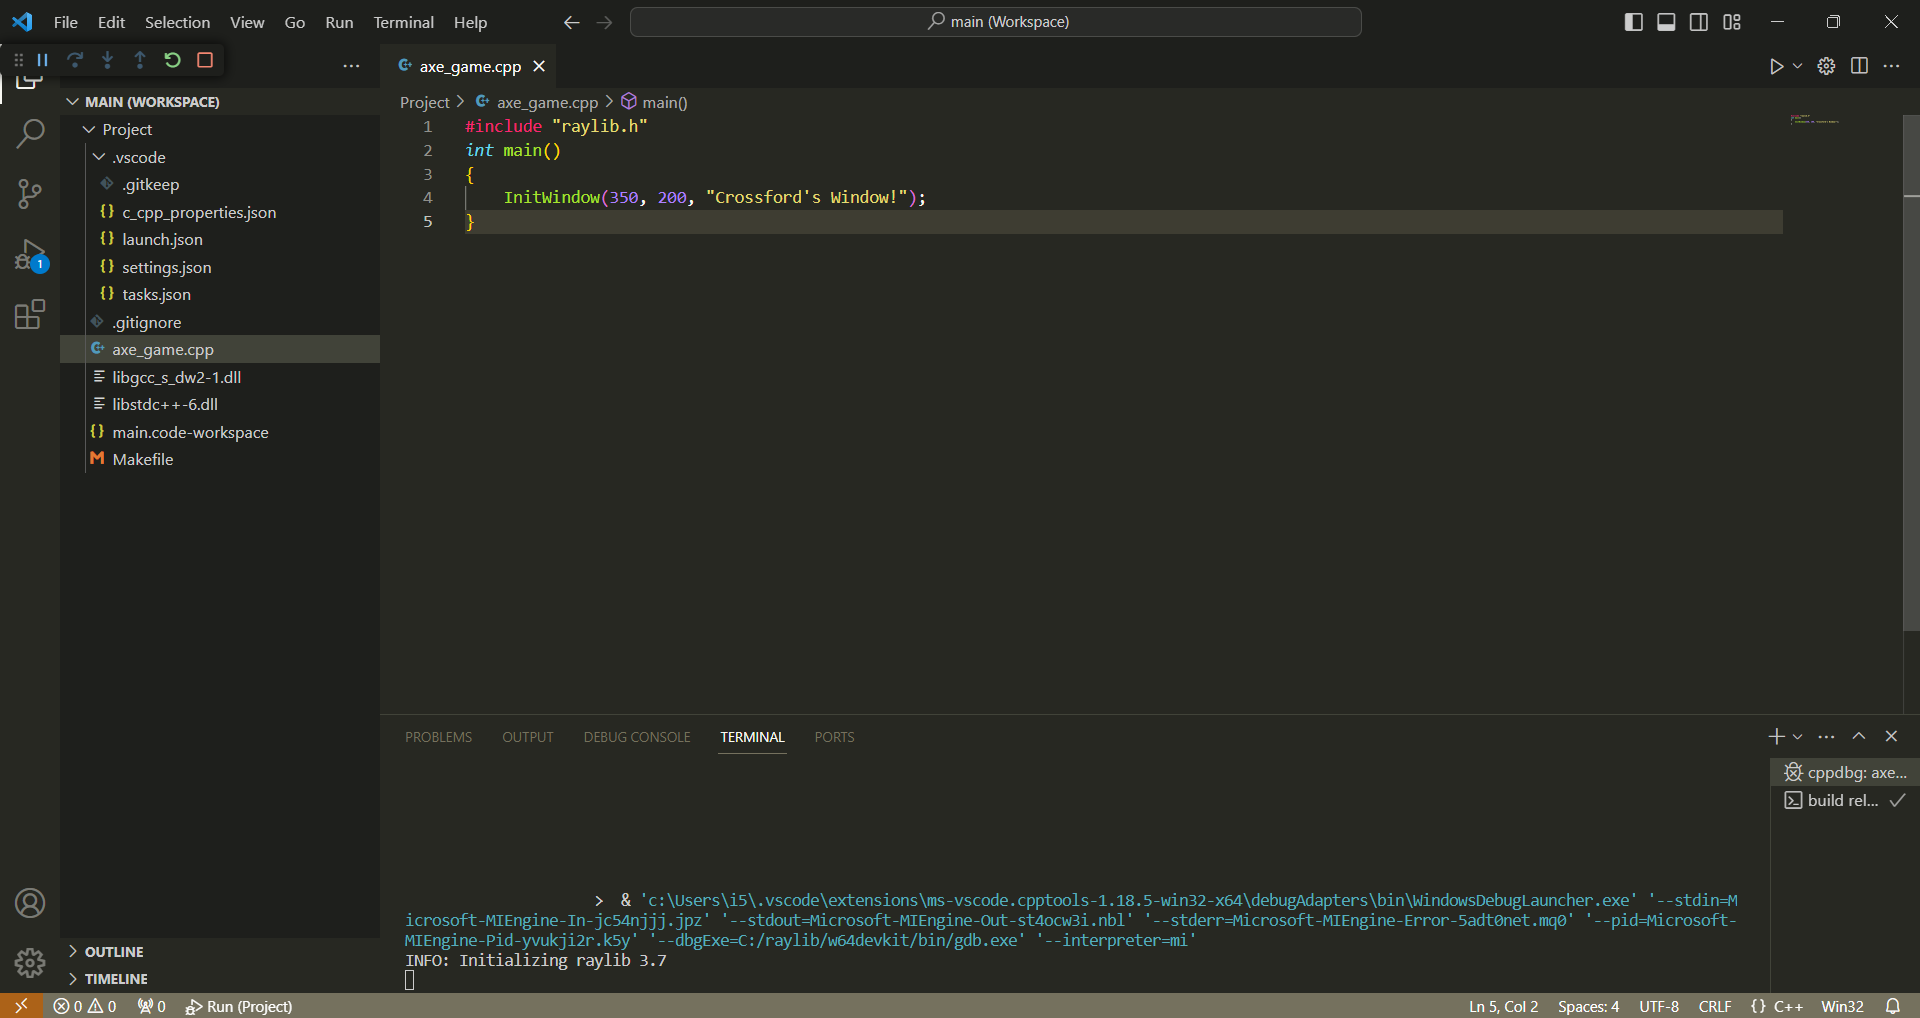
Here’s what the debug console said with the code from my initial screenshot:
=thread-group-added,id=“i1”
GNU gdb (GDB) 8.1
Copyright (C) 2018 Free Software Foundation, Inc.
License GPLv3+: GNU GPL version 3 or later http://gnu.org/licenses/gpl.html
This is free software: you are free to change and redistribute it.
There is NO WARRANTY, to the extent permitted by law. Type “show copying”
and “show warranty” for details.
This GDB was configured as “i686-w64-mingw32”.
Type “show configuration” for configuration details.
For bug reporting instructions, please see:
http://www.gnu.org/software/gdb/bugs/.
Find the GDB manual and other documentation resources online at:
http://www.gnu.org/software/gdb/documentation/.
For help, type “help”.
Type “apropos word” to search for commands related to “word”.
Warning: Debuggee TargetArchitecture not detected, assuming x86_64.
=cmd-param-changed,param=“pagination”,value=“off”
[New Thread 5976.0x7828]
[New Thread 5976.0x69d0]
[New Thread 5976.0x6240]
[New Thread 5976.0x6e24]
[New Thread 5976.0x64e0]
[New Thread 5976.0x75c4]
Thread 6 received signal SIGTRAP, Trace/breakpoint trap.
[Switching to Thread 5976.0x75c4]
0x77258de0 in ntdll!RtlUserThreadStart () from C:\Windows\SYSTEM32\ntdll.dll
Loaded ‘C:\Windows\SYSTEM32\ntdll.dll’. Symbols loaded.
Loaded ‘C:\Windows\System32\kernel32.dll’. Symbols loaded.
Loaded ‘C:\Windows\System32\KernelBase.dll’. Symbols loaded.
Loaded ‘C:\Windows\System32\gdi32.dll’. Symbols loaded.
Loaded ‘C:\Windows\System32\win32u.dll’. Symbols loaded.
Loaded ‘C:\Windows\System32\gdi32full.dll’. Symbols loaded.
Loaded ‘C:\Windows\System32\msvcp_win.dll’. Symbols loaded.
Loaded ‘C:\GameDev\Project\libgcc_s_dw2-1.dll’. Symbols loaded.
Loaded ‘C:\Windows\System32\ucrtbase.dll’. Symbols loaded.
Loaded ‘C:\Windows\System32\msvcrt.dll’. Symbols loaded.
Loaded ‘C:\Windows\System32\user32.dll’. Symbols loaded.
Loaded ‘C:\Windows\System32\shell32.dll’. Symbols loaded.
Loaded ‘C:\Windows\SYSTEM32\winmm.dll’. Symbols loaded.
Loaded ‘C:\Windows\SysWOW64\imm32.dll’. Symbols loaded.
Loaded ‘C:\Windows\SysWOW64\uxtheme.dll’. Symbols loaded.
Loaded ‘C:\Windows\SysWOW64\combase.dll’. Symbols loaded.
Loaded ‘C:\Windows\SysWOW64\rpcrt4.dll’. Symbols loaded.
Execute debugger commands using "-exec ", for example “-exec info registers” will list registers in use (when GDB is the debugger)
My pc is a laptop with Windows 11 as the OS.
The processor is: Intel Core i5-11400H
The graphics card is: NVIDIA GeForce RTX 3050 Laptop GPU
The memory is: 8 GB RAM
When using the code you’ve shown, the behavior appears identical in the terminal.
The main difference in the debug console is that there are 8 threads instead of 6, and the addition of these lines:
Loaded ‘C:\Windows\SysWOW64\dinput8.dll’. Symbols loaded.
Loaded ‘C:\Windows\SysWOW64\advapi32.dll’. Symbols loaded.
Loaded ‘C:\Windows\SysWOW64\sechost.dll’. Symbols loaded.
Loaded ‘C:\Windows\SysWOW64\bcrypt.dll’. Symbols loaded.
Loaded ‘C:\Windows\SysWOW64\XInput1_4.dll’. Symbols loaded.
Loaded ‘C:\Windows\SysWOW64\cfgmgr32.dll’. Symbols loaded.
Loaded ‘C:\Windows\SysWOW64\devobj.dll’. Symbols loaded.
Loaded ‘C:\Windows\SysWOW64\dwmapi.dll’. Symbols loaded.
Loaded ‘C:\Windows\SysWOW64\SHCore.dll’. Symbols loaded.
Loaded ‘C:\Windows\SysWOW64\T_Prevent.dll’. Symbols loaded.
Loaded ‘C:\Windows\SysWOW64\winspool.drv’. Symbols loaded.
Loaded ‘C:\Windows\SysWOW64\shlwapi.dll’. Symbols loaded.
Loaded ‘C:\Windows\SysWOW64\ole32.dll’. Symbols loaded.