Did you just update your C++ extension?
If this the case then look at the following.
opened 03:07PM - 13 Aug 21 UTC
bug
debugger
Bug-type: Debugger
**Describe the bug**
- OS and Version: Windows 10 Home
-… VS Code Version: 1.59.0
- C/C++ Extension Version: 1.6.0-insiders: August 12, 2021
- Other extensions you installed (and if the issue persists after disabling them):
Disabled all other extensions except C/C++ Extension but still the issue persists.
tried enabling disabling extension but didn't work.
### Bug Details
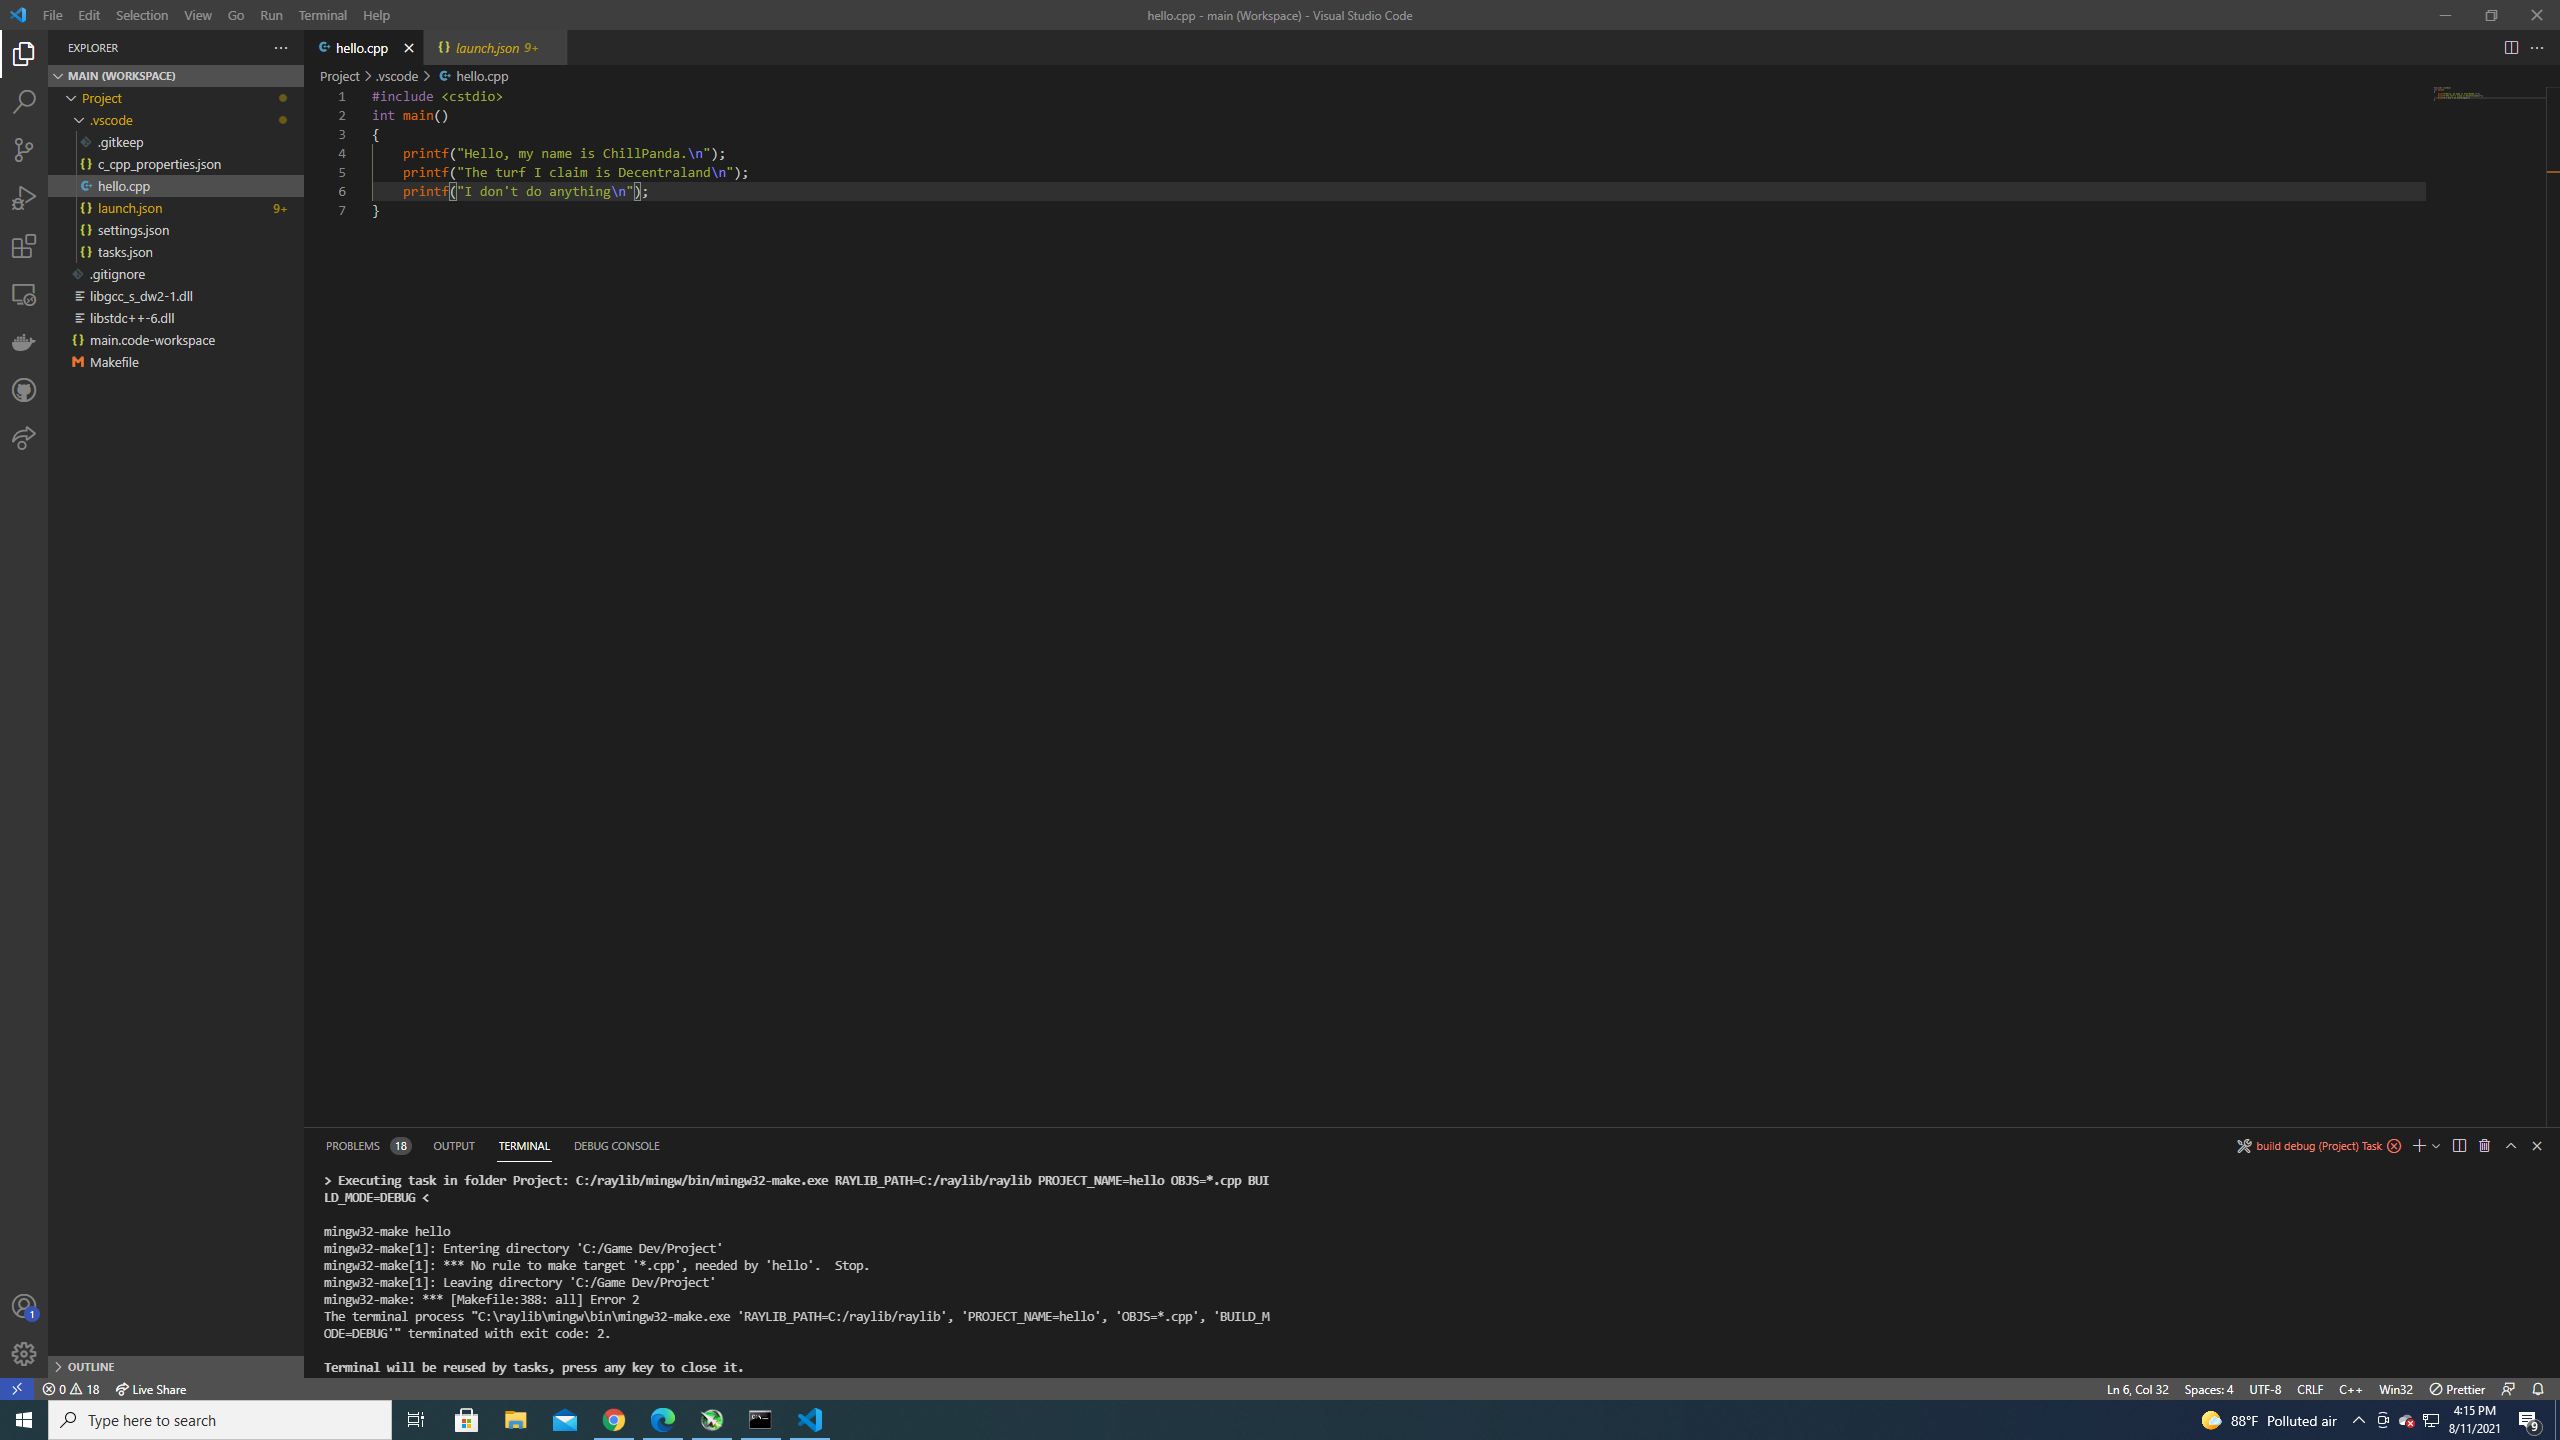
-- Debugging feature seems to have broken in the recent update. When the debugging process is started, it shows up only for a few seconds and then ends. The program builds successfully but seems like the debugger never starts, the process ends right there, and no output in the debugging console. I even rolled back to the previous version of my code which is working during debugging process in the previous version but still, the same problem persists. I also tried changing my configs, disabling, and enabling extension but nothing seems to work but if rollback to the previous version of the extension then everything works as expected.
Refer to the below video 👇
https://user-images.githubusercontent.com/57342034/129374367-187c6444-5122-42c5-96b6-840054966f91.mov
**To Reproduce**
- Install the C/C++ Extension Version 1.6.0-insiders: August 12, 2021, to reproduce the issue.
- Start the debugging process
<details>
<summary> Launch.json file </summary>
<div>
<pre>
<code>
{
"version": "0.2.0",
"configurations": [
{
"name": "g++.exe - Build and debug active file",
"type": "cppdbg",
"request": "launch",
"program": "${fileDirname}\\${fileBasenameNoExtension}.exe",
"args": [],
"stopAtEntry": true,
"cwd": "${fileDirname}",
"environment": [],
"externalConsole": false,
"MIMode": "gdb",
"miDebuggerPath": "C:\\Program Files\\mingw-w64\\x86_64-8.1.0-posix-seh-rt_v6-rev0\\mingw64\\bin\\gdb.exe",
"setupCommands": [
{
"description": "Enable pretty-printing for gdb",
"text": "-enable-pretty-printing",
"ignoreFailures": false
}
],
"preLaunchTask": "C/C++: g++.exe build active file"
}
]
}
</code>
</pre>
</div>
</details>
Steps to reproduce the behavior:
1. Recent update must be installed
2. Starts the debugging process
2. Terminal fires up and build the file
- Nothing happens after 2 steps, debugging stops. No output in the debugging console and no error.
**Additional context**
- Issue only shows up in the recent update
- Upon re-installing the previous version of the extension, the issue resolves without changing anything else.
There issue with C++ extension downloading the wrong debugger for your OS
WardenGnaw has pinned the solution.
In summary you just need to delete following files and folder in your profile and it will download the correct version once you relaunch VSCode
To resolve this issue for Win 10 users, delete the following files:
1. %USERPROFILE%.vscode\extensions\ms-vscode.cpptools-1.6.0-insiders\install.lock 2. %USERPROFILE%.vscode\extensions\ms-vscode.cpptools-1.6.0-insiders\debugAdapters
Then relaunch VS Code and have the extension activate again.