How to attach debugger to VSCode?

Hello there!

I have been trying to attach a gdb debugger to a launched game instance from PowerShell. I think I have almost done it but I have missed something.

Here is what I did:

First checked that I have gdb in my system. Then I configure a debug task in launch.json as it’s explained in the documentation. After that my configuration inside launch.json looked like this:

{
			"name": "(gdb) Debug attach",
			"type": "cppdbg",
			"request": "attach",
			"program": "C:\\FastEpicGamesLibrary\\UE_4.26\\Engine\\Binaries\\Win64\\UE4Editor.exe",
			"processId": "${command:pickProcess}",
			"MIMode": "gdb",
			"miDebuggerPath": "C:\\Program Files\\mingw-w64\\x86_64-8.1.0-posix-seh-rt_v6-rev0\\mingw64\\bin\\gdb.exe",
			"setupCommands": [
				{
					"description": "Some description",
					"text": "-enable-pretty-printing",
					"ignoreFailures": true
				}
			]
		},

The final step is to launch de debug and try to attach it to the process of the instance I’ve previously called. That’s when this window appears:

image

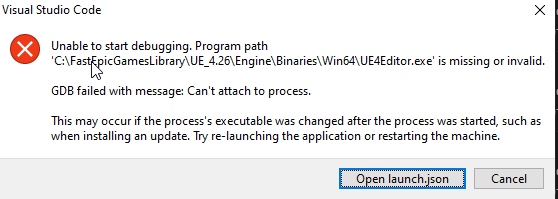
I have been able to attach it to other processes but maybe an unreal game instance is different and I have to attach it to the terminal instead of the proper game or something tricky I can’t even imagine.

I launched the game instance with the following command in powershell:

&“C:\FastEpicGamesLibrary\UE_4.26\Engine\Binaries\Win64\UE4Editor.exe” “D:\VideoGamesProjects\PuzzlePlatforms\PuzzlePlatforms.uproject” -game -log

You’re on Windows so wouldn’t be using the GNU debugger. When creating the config there’s another option for attach which is “C/C++: (Windows) Attach” which would generate

{
	"name": "(Windows) Attach",
	"type": "cppvsdbg",
	"request": "attach",
	"processId": "${command:pickProcess}"
},

Then it should work with that, the main difference is "type": "cppdbg" vs "type": "cppvsdbg".

You might want to also copy the "visualizerFile": field from the other configs for a better debugging experience. Also halting at a breakpoint can take a while (at least initially I think) so just be patient if it seems to be frozen.

1 Like

I got it working after tweaking the “sourceFileMap” field. This question on unreal answer hub was useful.

Also as @DanM said I changed the type of debugger as the symbols refers to compiled code with visual c++ libraries and the GNU debugger works with another kind of compiled code (usually Linux related).

The final configuration that worked for me was the following:

		{
			"name": "(Windows) Attach",
			"type": "cppvsdbg",
			"request": "attach",
			"processId": "${command:pickProcess}",
			"visualizerFile": "C:\\FastEpicGamesLibrary\\UE_4.26\\Engine\\Extras\\VisualStudioDebugging\\UE4.natvis",
			"sourceFileMap": {
				"D:\\Build\\++UE4\\Sync": "C:\\FastEpicGamesLibrary\\UE_4.26"
			}
		},
1 Like

This topic was automatically closed 24 hours after the last reply. New replies are no longer allowed.

Privacy & Terms