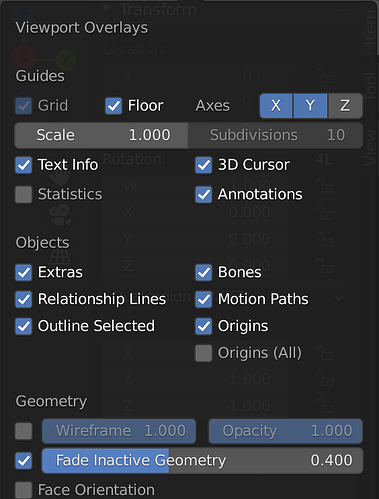
Hey all! Really enjoying this course! Idk if “ask” is the right tag but I wasn’t able to see those nice red and blue curves that help visualize the x and z IK limits until I ticked “Relationship Lines” in the Viewport Overlays.
Posting here because it took me a few minutes of digging to figure and hope it can help someone else in the same position 


