So I don’t think what you posted above was the problem. There are sometimes where I find some new lines in settings, but I deleted them because I thought they weren’t necessary … I really hope they weren’t.
Do you know what else might be causing the problems?
I had to also had to take away telemetry because the settings file kept on giving me errors.
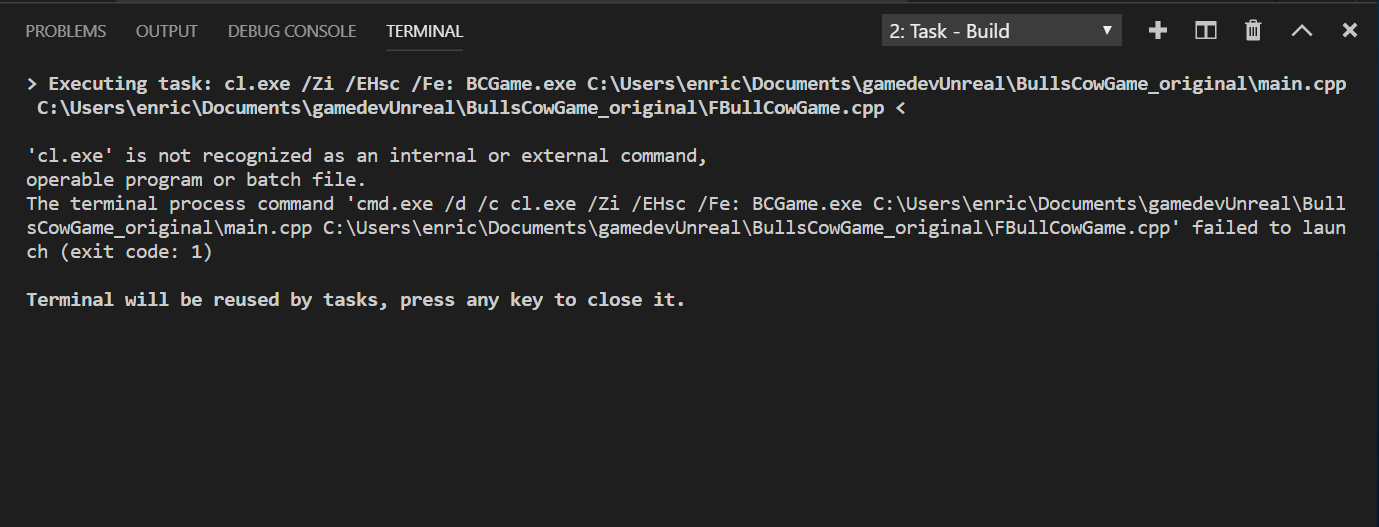
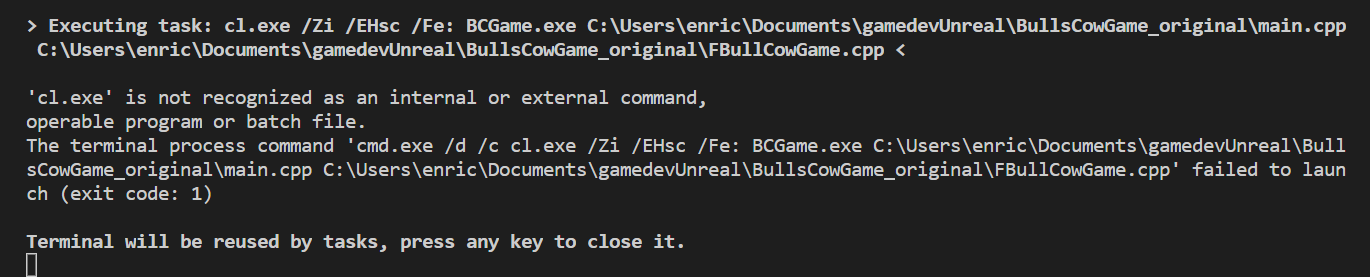
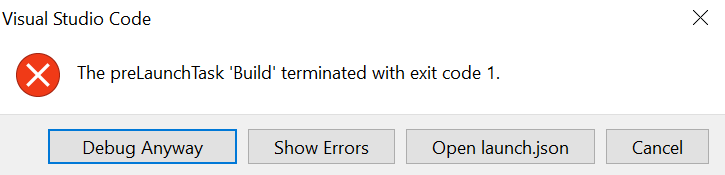
It still doesn’t work with the terminal.integratd.shell... lines taken away. Here are some screenshots of what I get when I build and when I debug:
And to answer your last question: yes, I have always built from the developer command prompt by typing cl .... That’s what was always shown in the videos so I did that. Should I now permanently switch to using “Ctrl+Shift+B”?
Did you close down the terminal you had open and start a new one?
Launching VS Code from the developer command prompt is a recent (about a week) change which is why I asked. That code you have in the settings is what the original 2019 version had done instead.
I mean that’s one of the reasons to create a build task, so you don’t have to enter all of that manually.
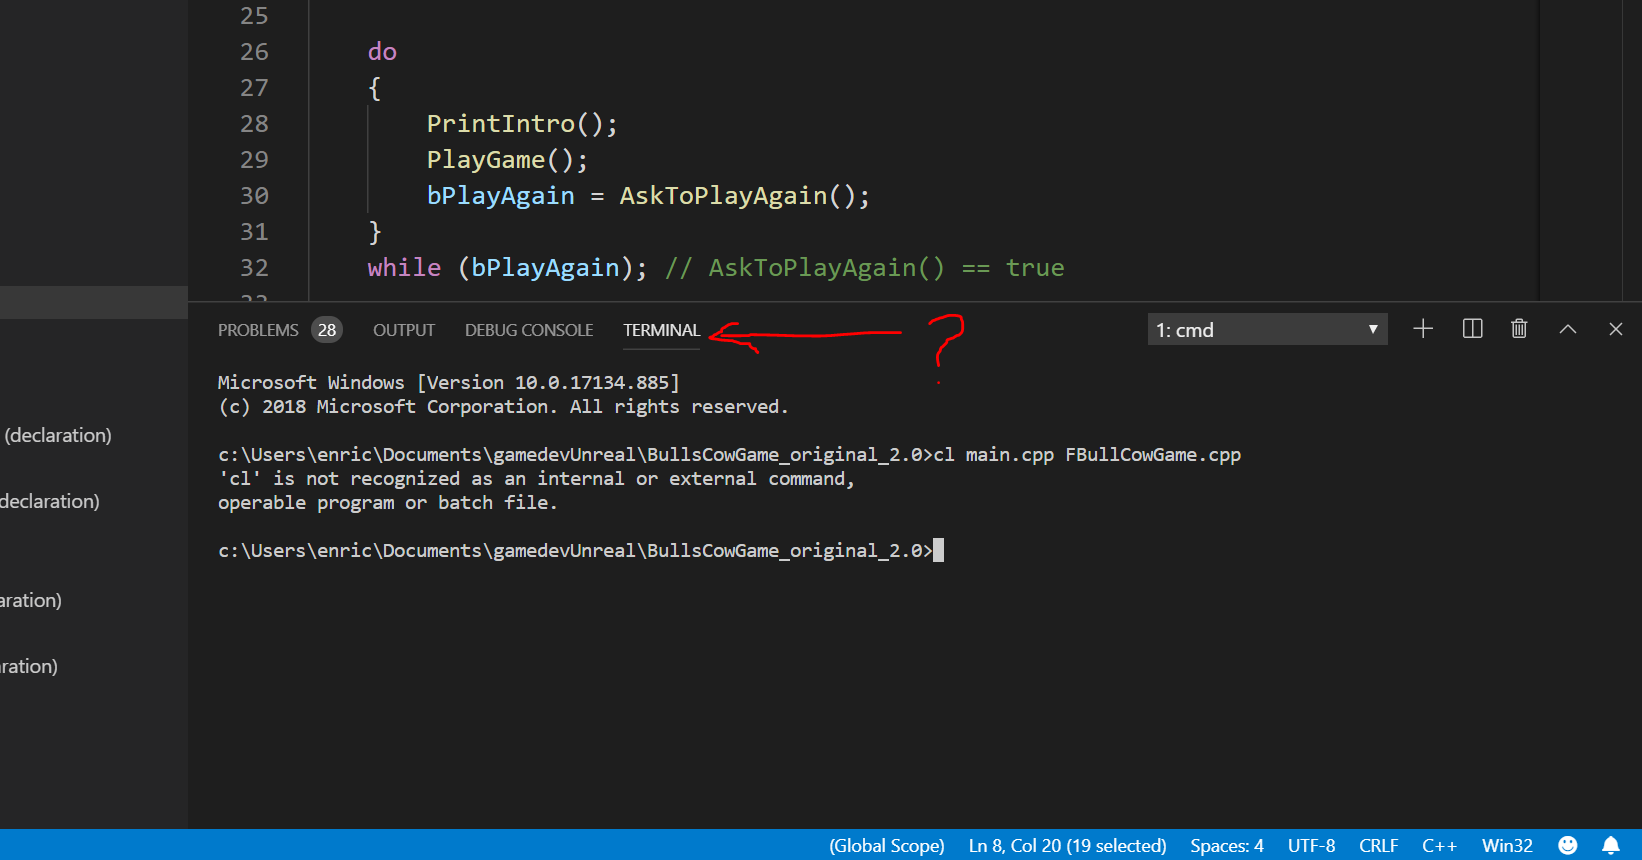
Even when I close the terminal and open a new one I still get the same message.
I’m actually not following the 2019 WIP course. I’m doing my best at following the original/old Bulls and Cows version that used the full Visual Studio. That’s why I’m having so much difficulty debugging–it was never explained in the old videos.
I’m also wondering since I can no longer build, should I make a new VS Code folder and copy and paste my code from this project? I’m asking because I can’t continue with the lectures or course challenges without the ability to build. I’m still very interested in figuring out these debugging problems, but in the mean time do you think it would be smart to do start a “new” Bulls and Cows game?
As always, thank you so much for all your help! I would never have gotten this far without you!
Thanks,
Enrico
P.S. I also just saw this show up: [SOLVED] An Issue with Unverified Breakpoints. Do you think I should also try with an external console? After all, @Edward_Ro had the same original problems as me, before my problems spiraled out of control… (I guessing, like you said in the aforementioned post, that these problems are the result of bugs in VS Code .)
I tried changing the console to external in my original project and it still did not work.
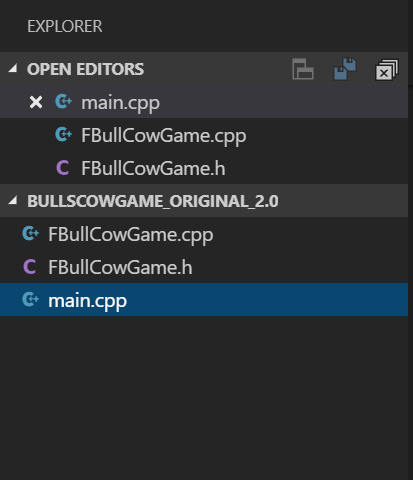
So, I reverted to “Plan B” and made a new file; new main.cpp, FBullCowGame.cpp, and FBullCowGame.h files; and copied and pasted my code from my original files in these new files. Hoped it would work, but, of course, it didn’t.
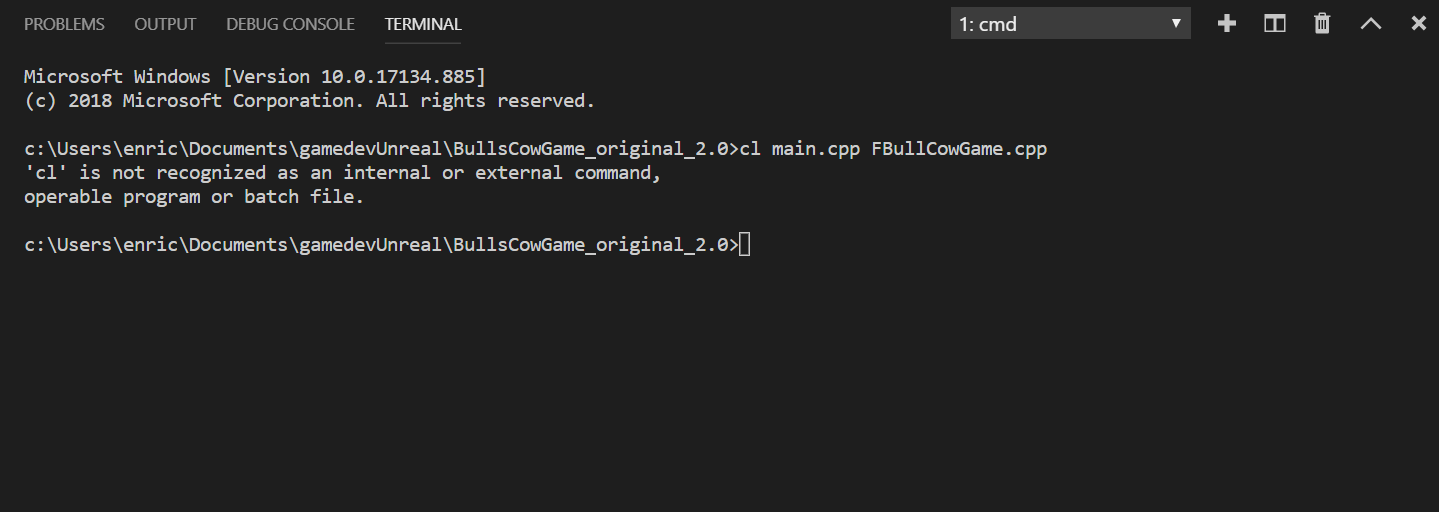
When I compiled using my original cl .... method I get this error (which is the same error I was getting with the other project):
I haven’t copied and pasted the launch.json or settings.json yet because I wanted to keep the folder simple without any extra files–basically, I wanted to keep it with the same number of files before the original folder went haywire. Here is my explorer in the certain case that my explanation didn’t work:
What should I do to fix this fatal problem? Could it be something in the VS Code settings file?
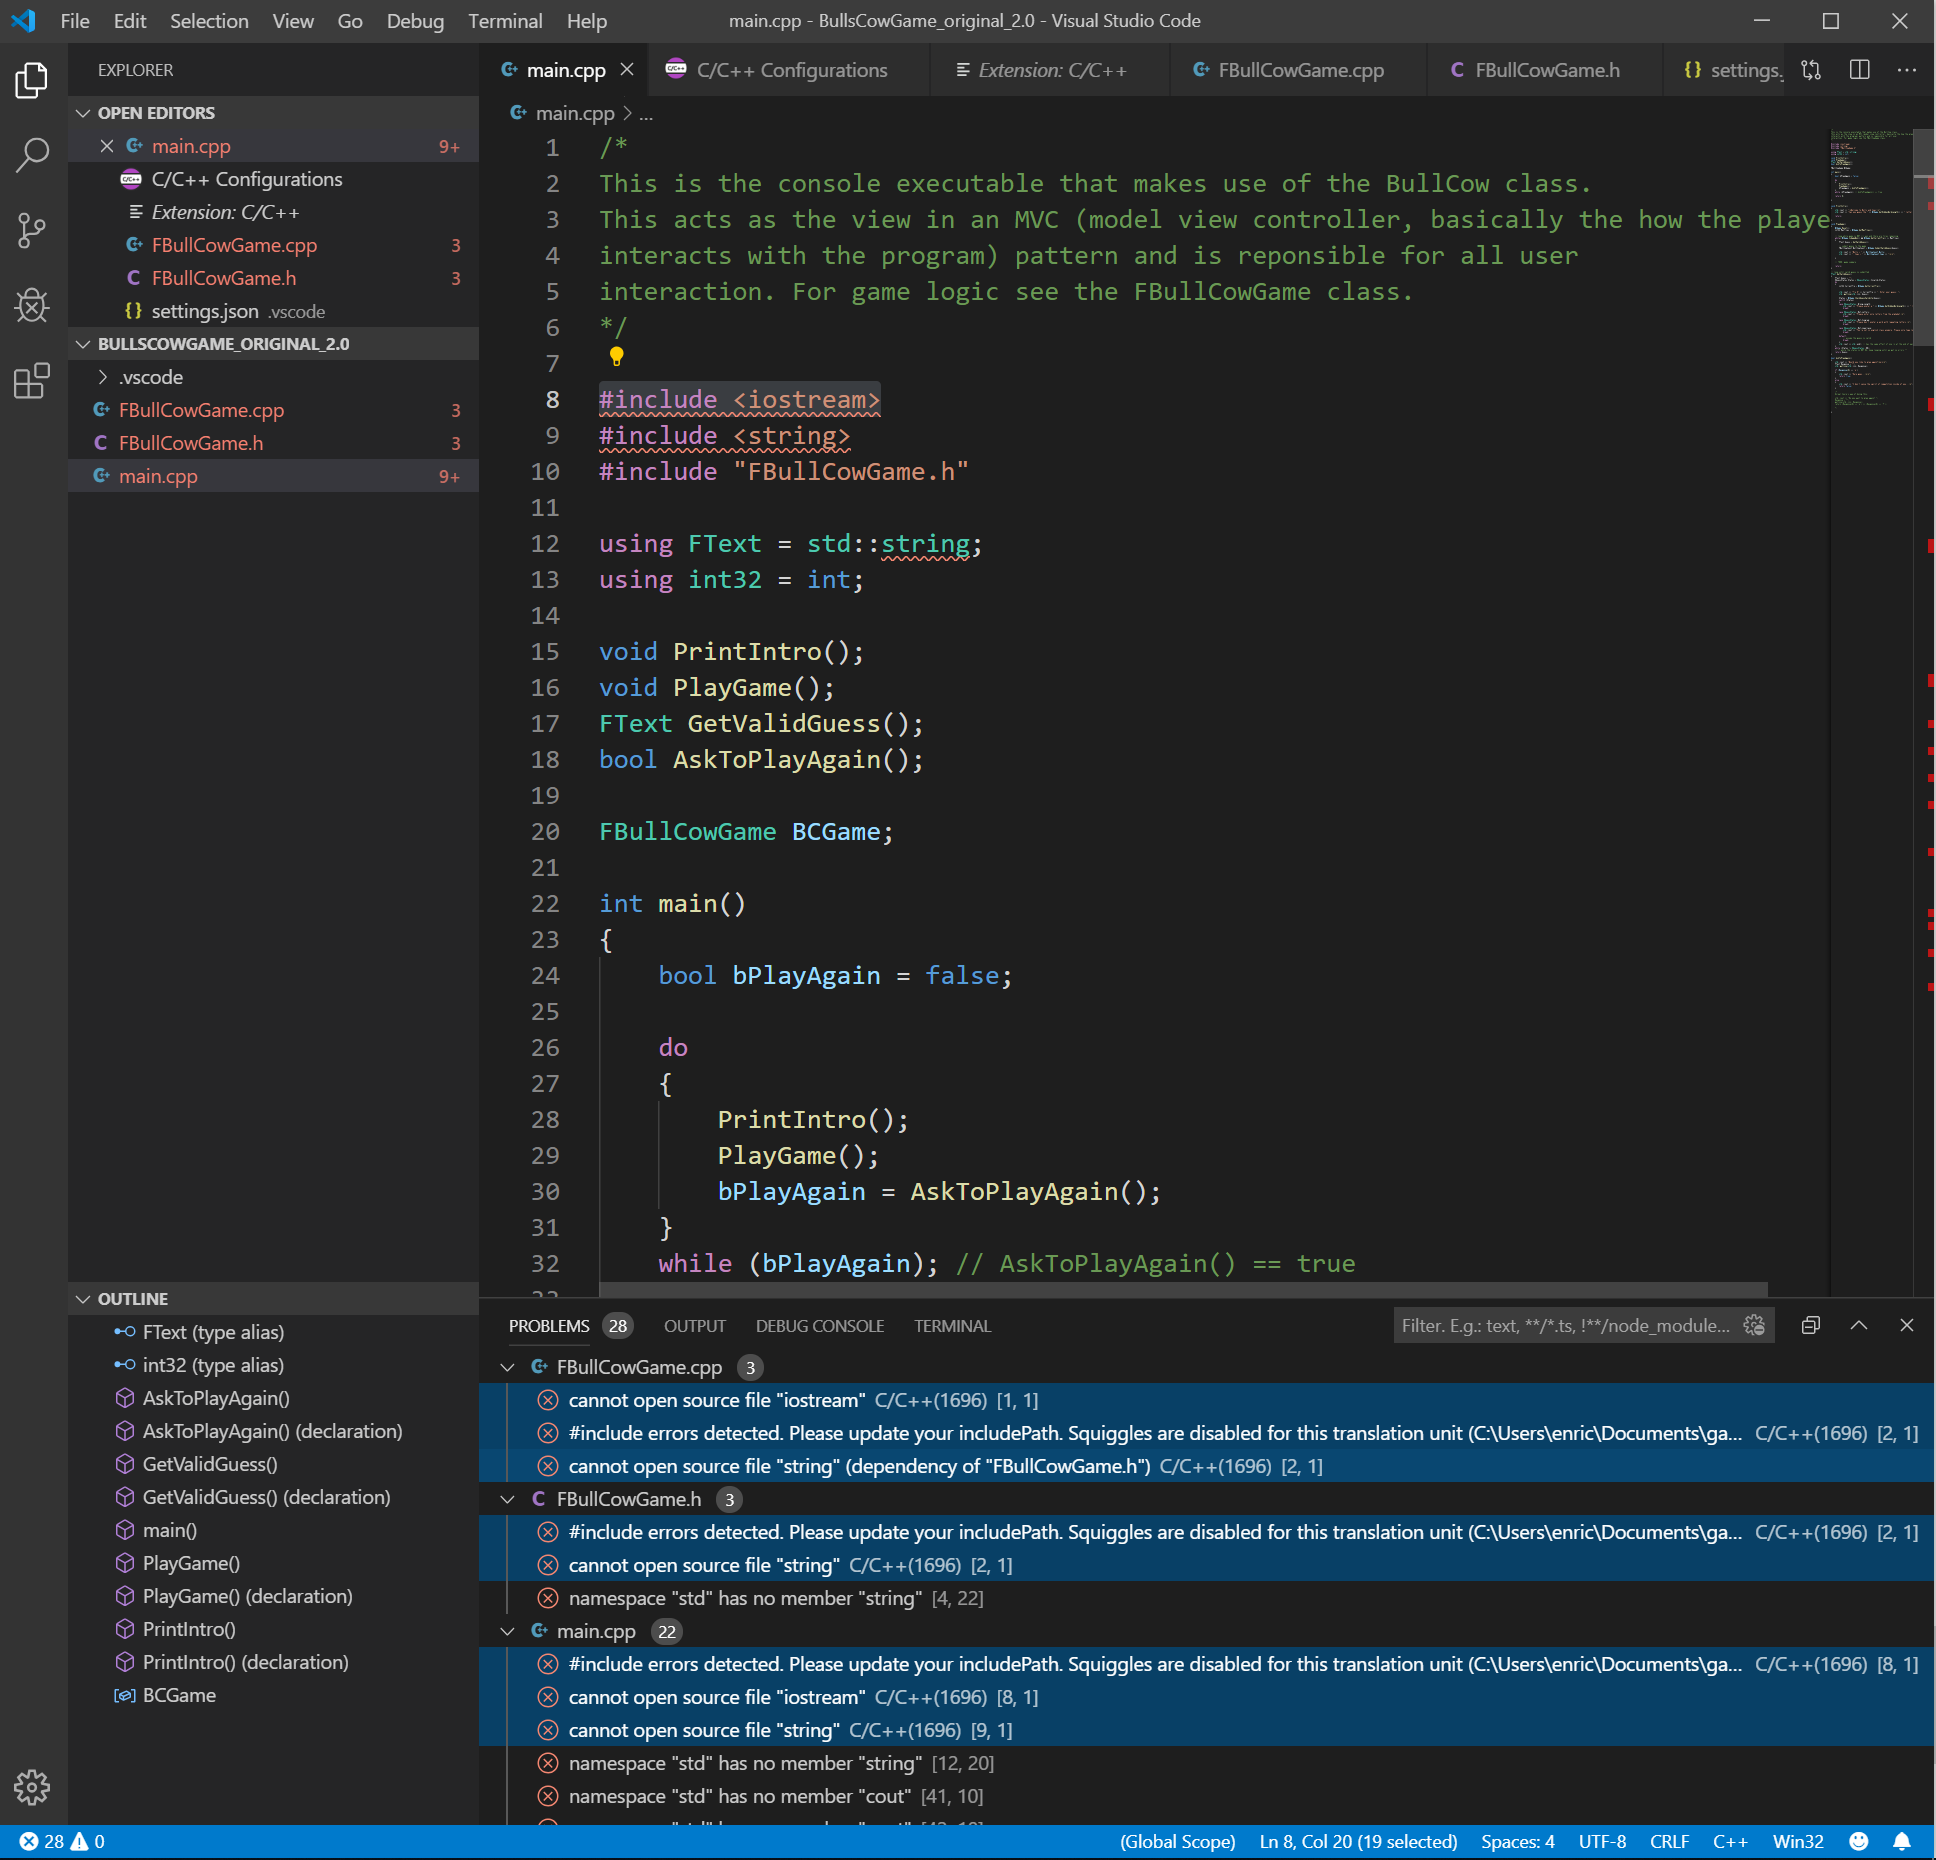
I’m tried an ultimatum solution by uninstalling and reinstalling VS Code. But … you were right, it didn’t solve any problems and actually added a new one. Now my #inclde's aren’t working in all of my files.
Launching Code from the developer command prompt. Not compiling.
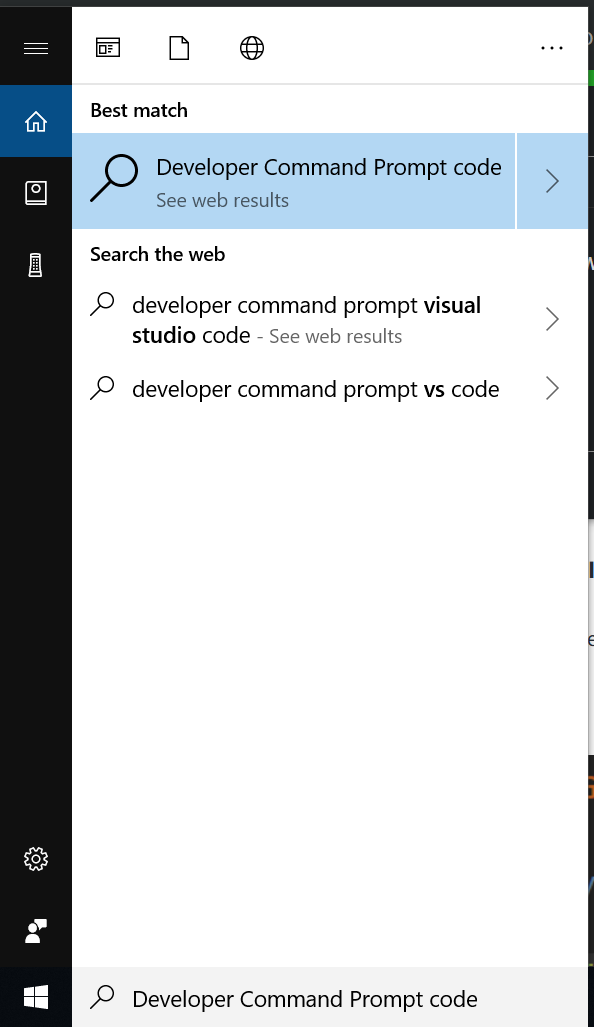
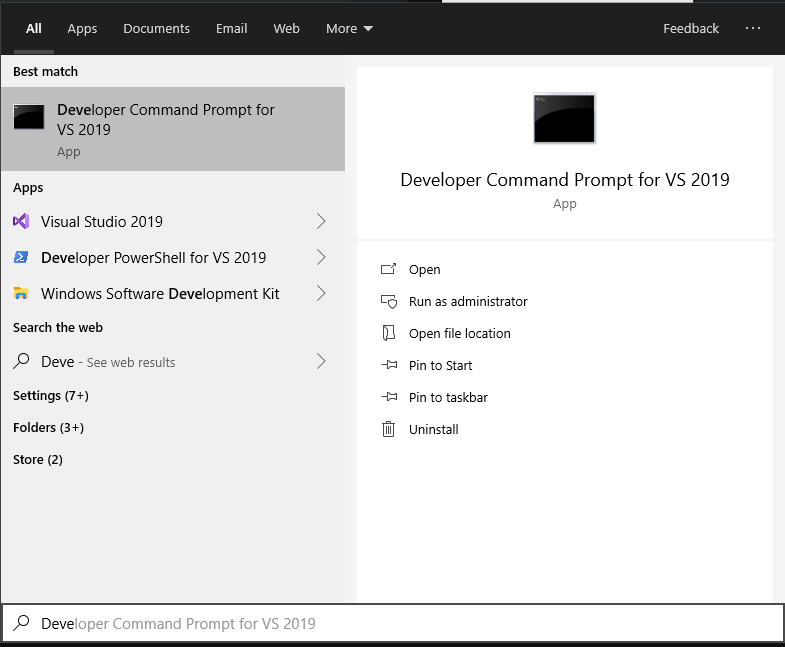
Open the start menu, search for Developer Command Prompt then type “code” and hit enter.
VS Code should launch and cl should now work in the integrated terminal.
I tried looking this problem up and I found a similar problem on StackOverflow and this was the solution:
VSCode is much more light-weight and is, in essence, a completely different product. VSCode doesn’t ship with a complete setup of MsBuild and of the compiler frameworks that ship with the full version of Visual Studio. You can install these alongside VSCode if You need them by installing “Build Tools for Visual Studio 2017”, you can find the installer all the way at the bottom of the Visual Studio download page.
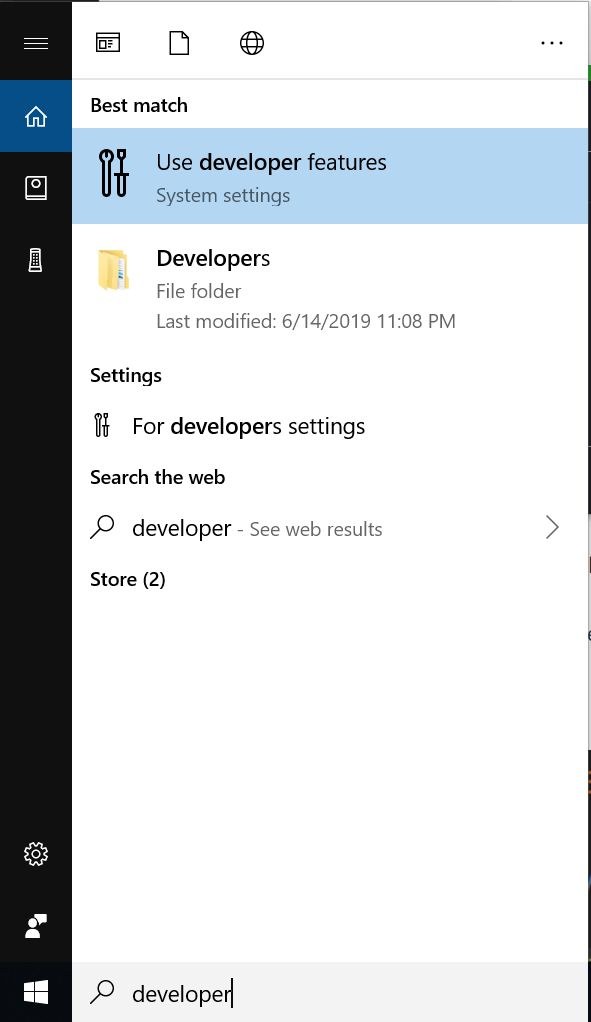
Therefore, when you type "Developer … " something shows up probably because you have Visual Studio installed.
Now I’m slightly confused. Did you uninstall Visual Studio? How were you able to compile beforehand?
If you had access to cl before you should have the developer command prompt.
Though yes, install the C++ build tools or VS Community with the C++ workload.
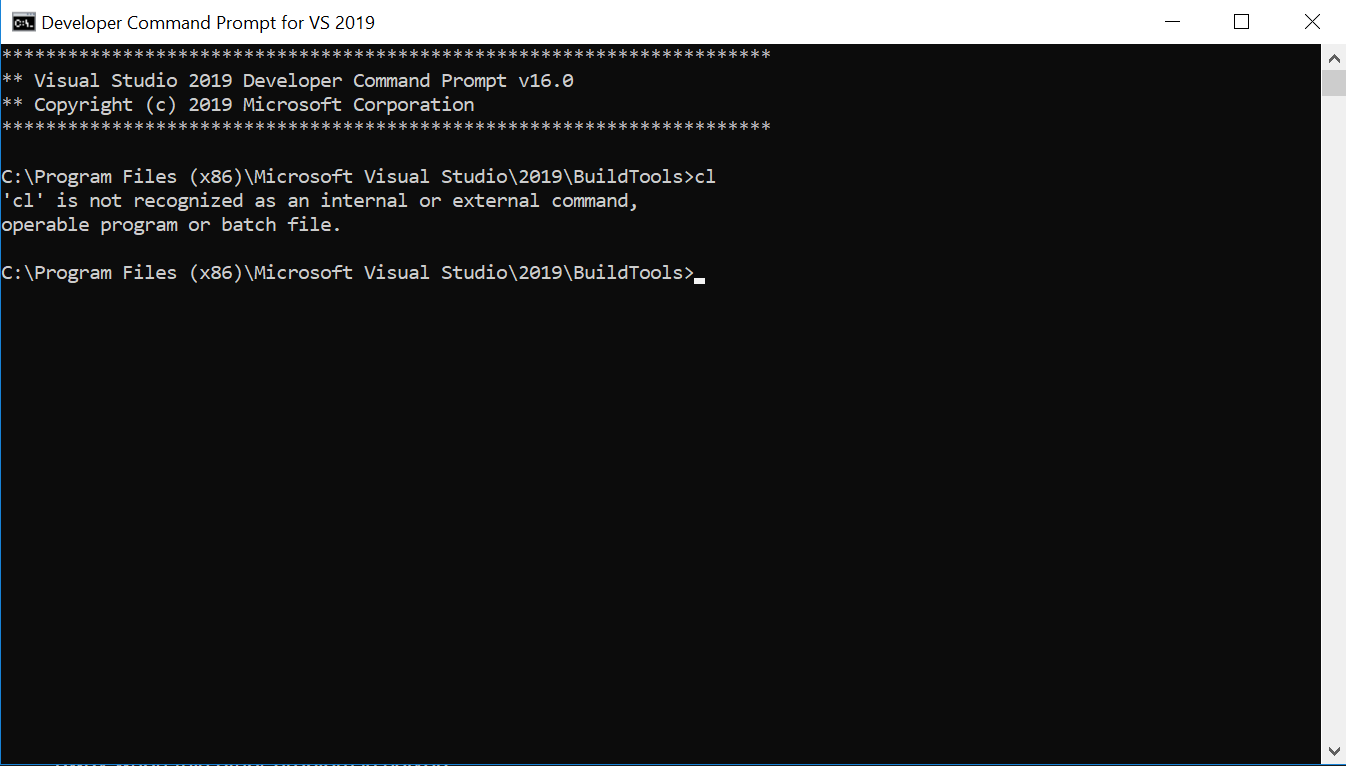
I downloaded the Build Tools for VS and now have access to the Developer Command Prompt. I tried what you said in Post #30, but cl still didn’t work.
I’m also very confused because before I was able to compile with absolutely no problem.
Also, I’m still having a problem with the #include that I talked about in Post #29.
It has information on how to configure the compiler. I think this is the key to breaking the safe but I’m having a bit of trouble finding what I need. On step 3 of the website it says:
Find the Compiler path setting. VS Code will attempt to populate it with a default compiler based on what it finds on your system. It first looks for the MSVC compiler, then for g++ on Windows Subsystem for Linux (WSL), then for g++ on Mingw-w64. For MSVC, the path should look something like this, depending on which specific version you have installed: “C:/Program Files (x86)/Microsoft Visual Studio/2017/BuildTools/VC/Tools/MSVC/14.16.27023/bin/Hostx64/x64/cl.exe”.
I can’t find anything under that path of my computer. Even when I search for cl.exe across my entire computer, file explorer still says that it can’t find it?
I have no idea how my cl.exe file was deleted, but do you know how I can get it back or find a new one?
Thank you so much,
Enrico
P.S. I’m still having a problem with the #include that I talked about in Post #29. I’m not sure if it will go away when this other problem is solved…

 .)
.)