I figured it out. Thanks for the help Dam.
Debugging in VS Code
Debug code with Visual Studio Code
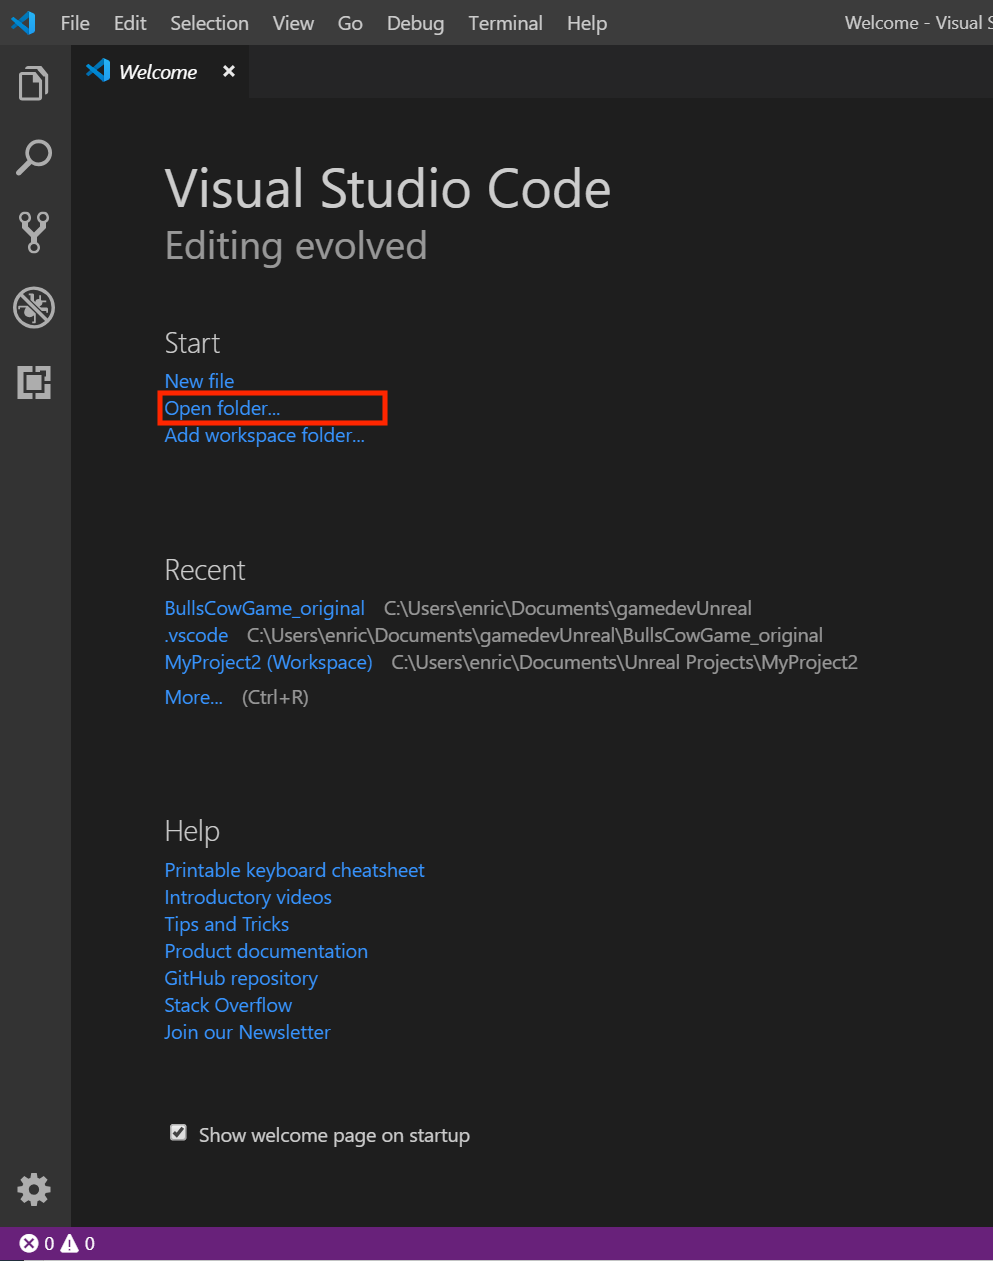
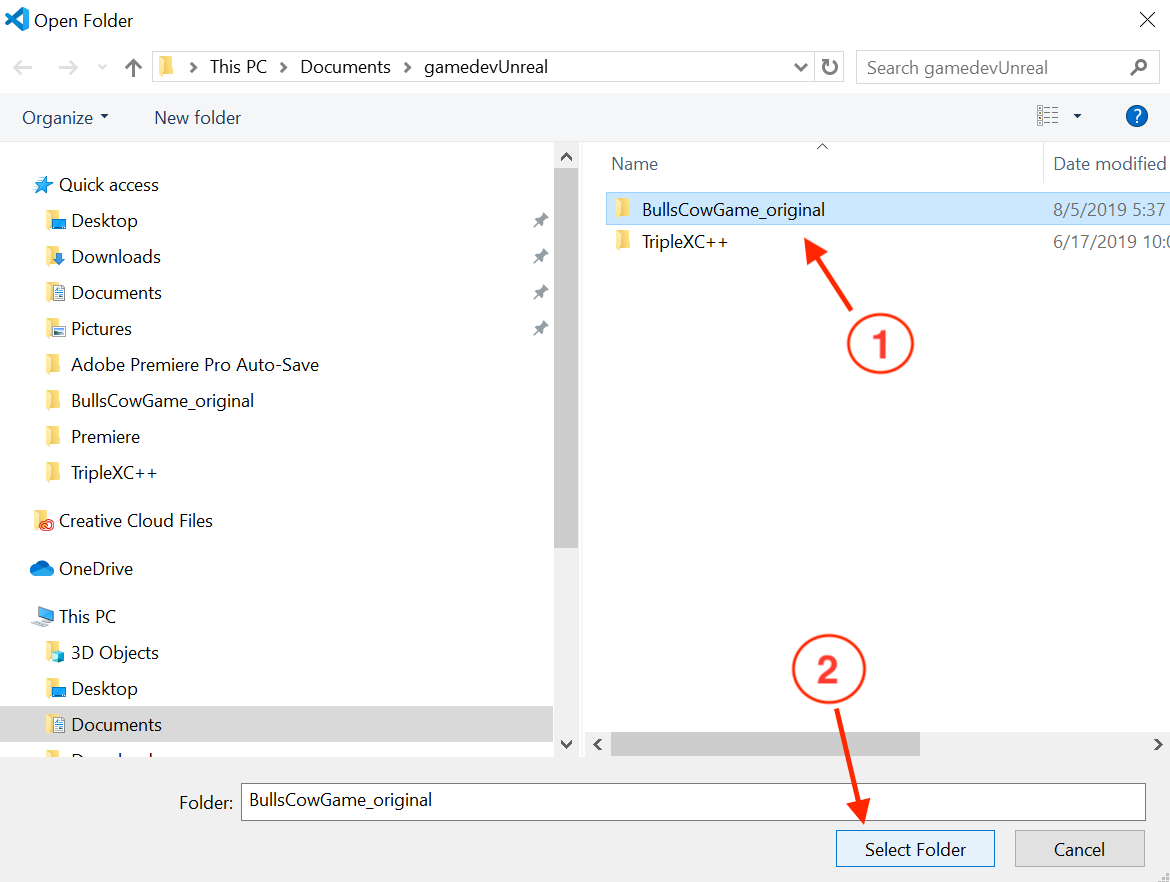
Step 1: Open the folder your project is in in VS Code
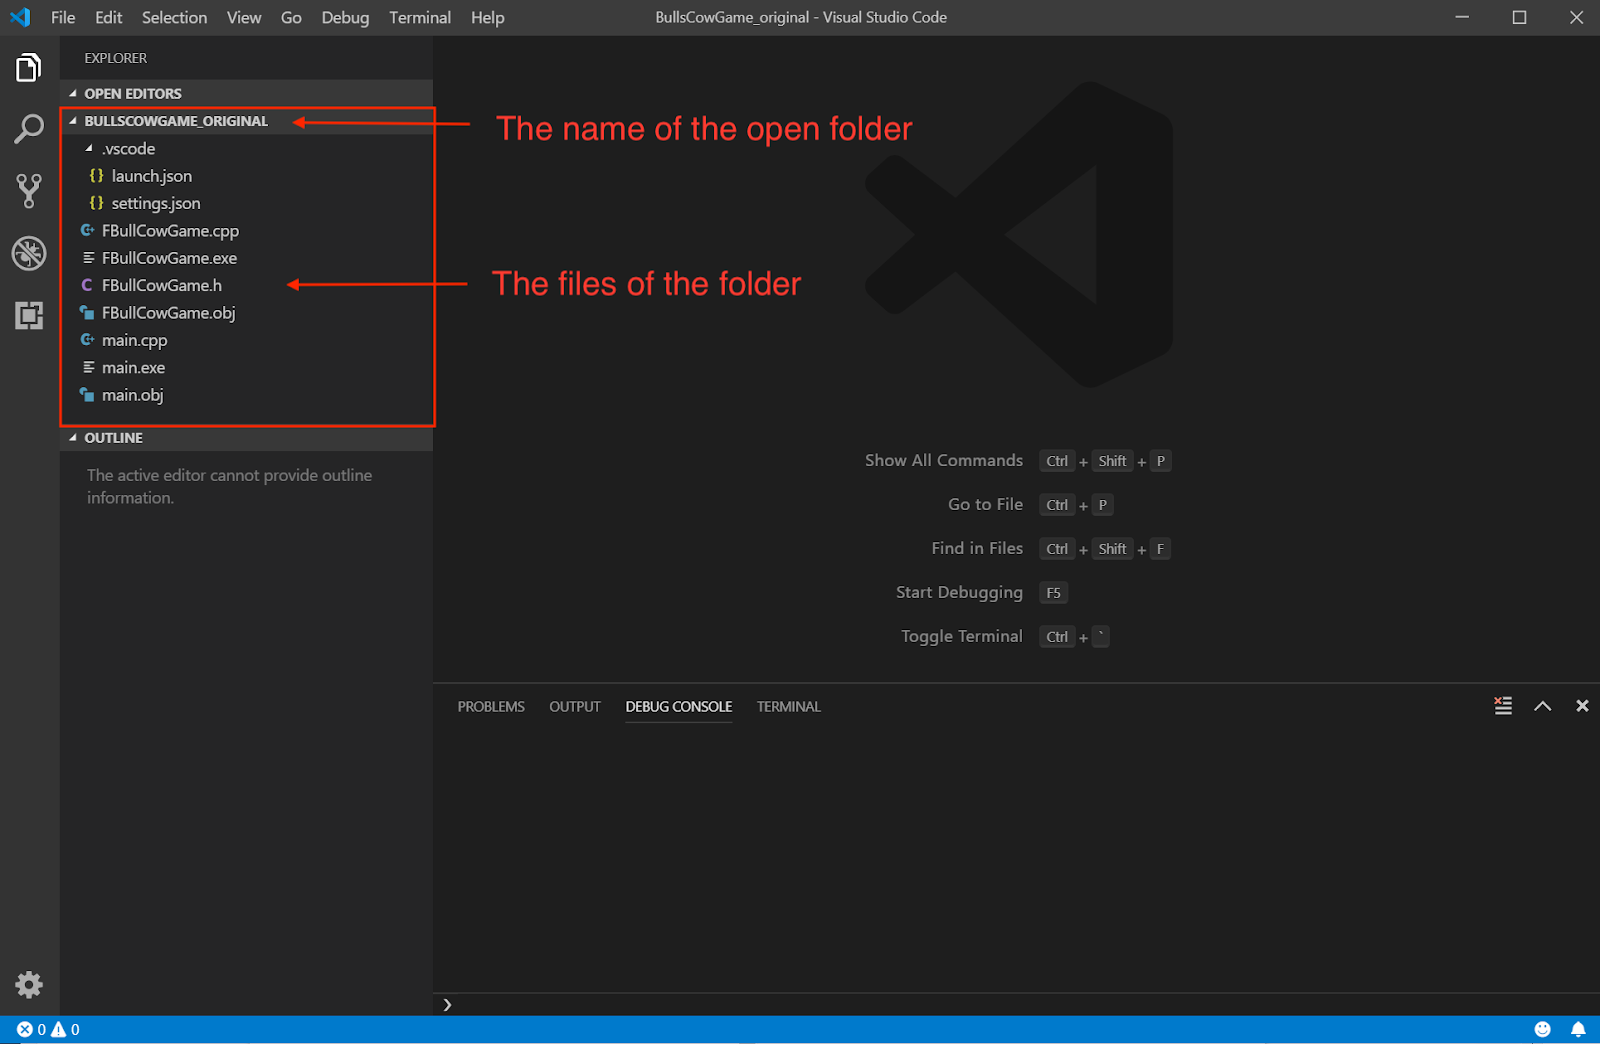
This should be the result:
Now that VS Code knows the folder that you are working in, you can begin starting the debugging process.
Step 2: Create a launch.json:
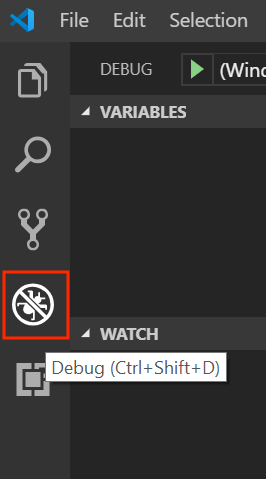
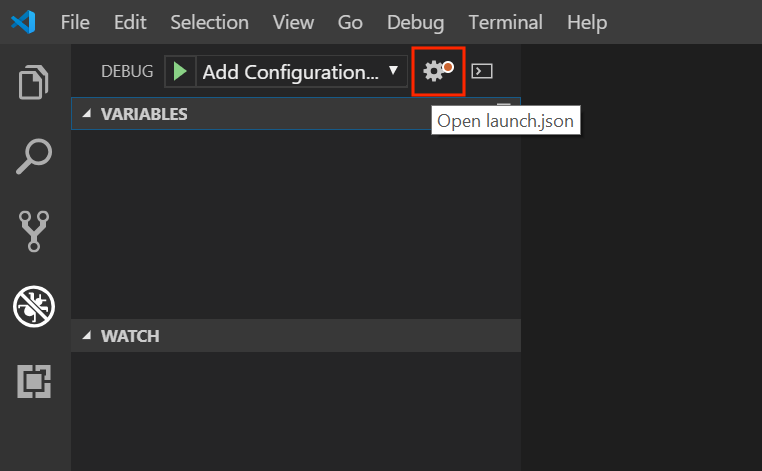
Open the debugging view (shown below) located in the Activity Bar on the left side of VS Code, or press Ctrl+Shift+D. The debugger shows all the information related to debugging.
To debug, you have to create a debugging configuration in a launch.json file. The launch.json file is located in a folder called .vscode (but this information is not important to debugging). To create a launch.json, click the Configure Gear icon on the Debug view top bar.
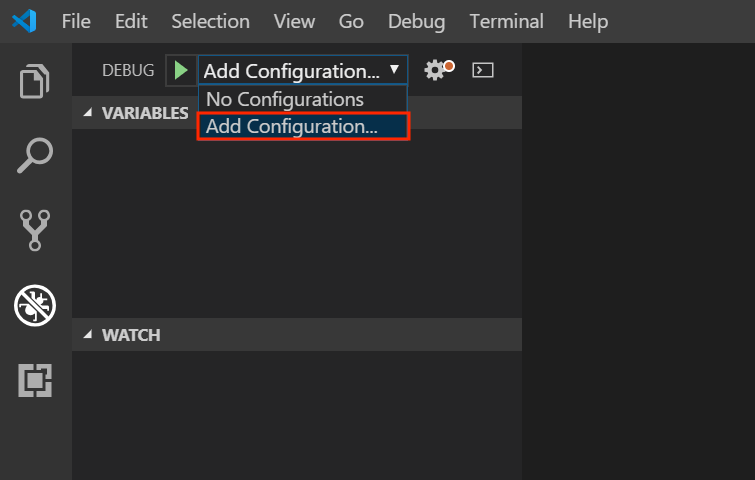
Alternatively, you can click the drop down menu with the green play button beside it that says “No Configurations.” Then click “Add Configuration…” so create a launch.json.
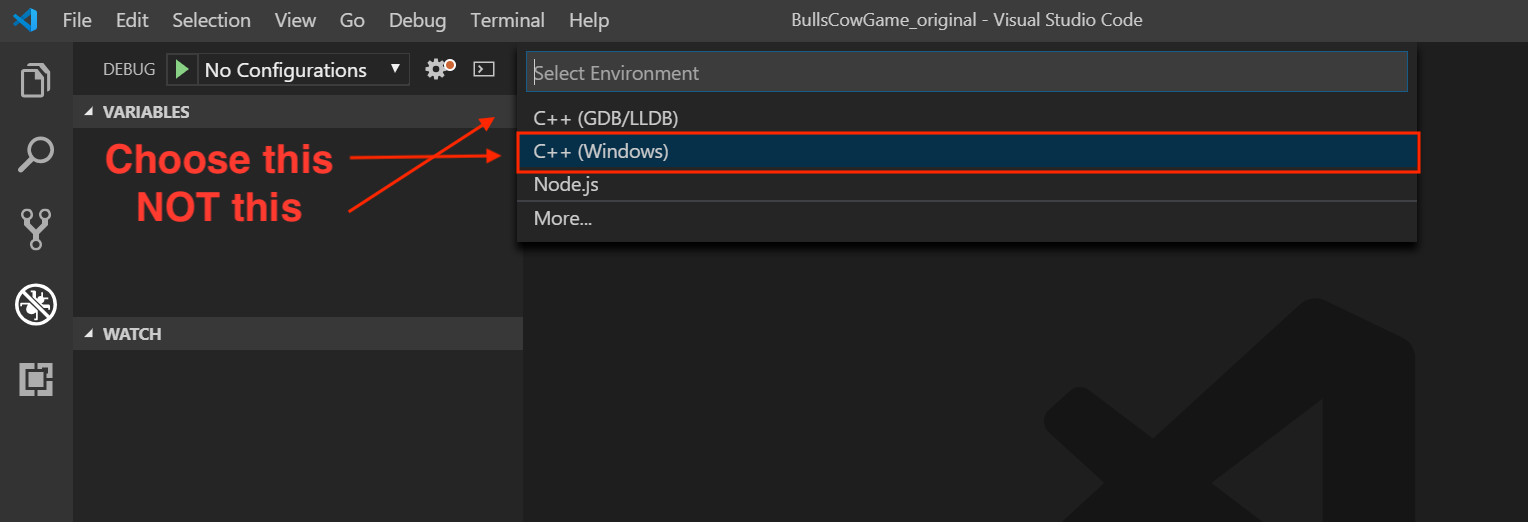
If VS Code doesn’t detect a debug environment (which it didn’t in my case), you will have to choose it manually:
- After doing either of the actions above a drop down menu will appear to the right of whatever you just clicked with several options.
- The drop down menu is called “Select Environment.”
- IMPORTANT: Choose C++ Windows as the environment, NOT C++ gdb (or whatever the option is. )
This is VERY important because you do not have the GDB debugger installed (by default) (http://www.gdbtutorial.com/). Therefore, you have to use the other Windows debugger. THIS IS THE MOST IMPORTANT STEP!
Step 3: Configure the launch.json file:
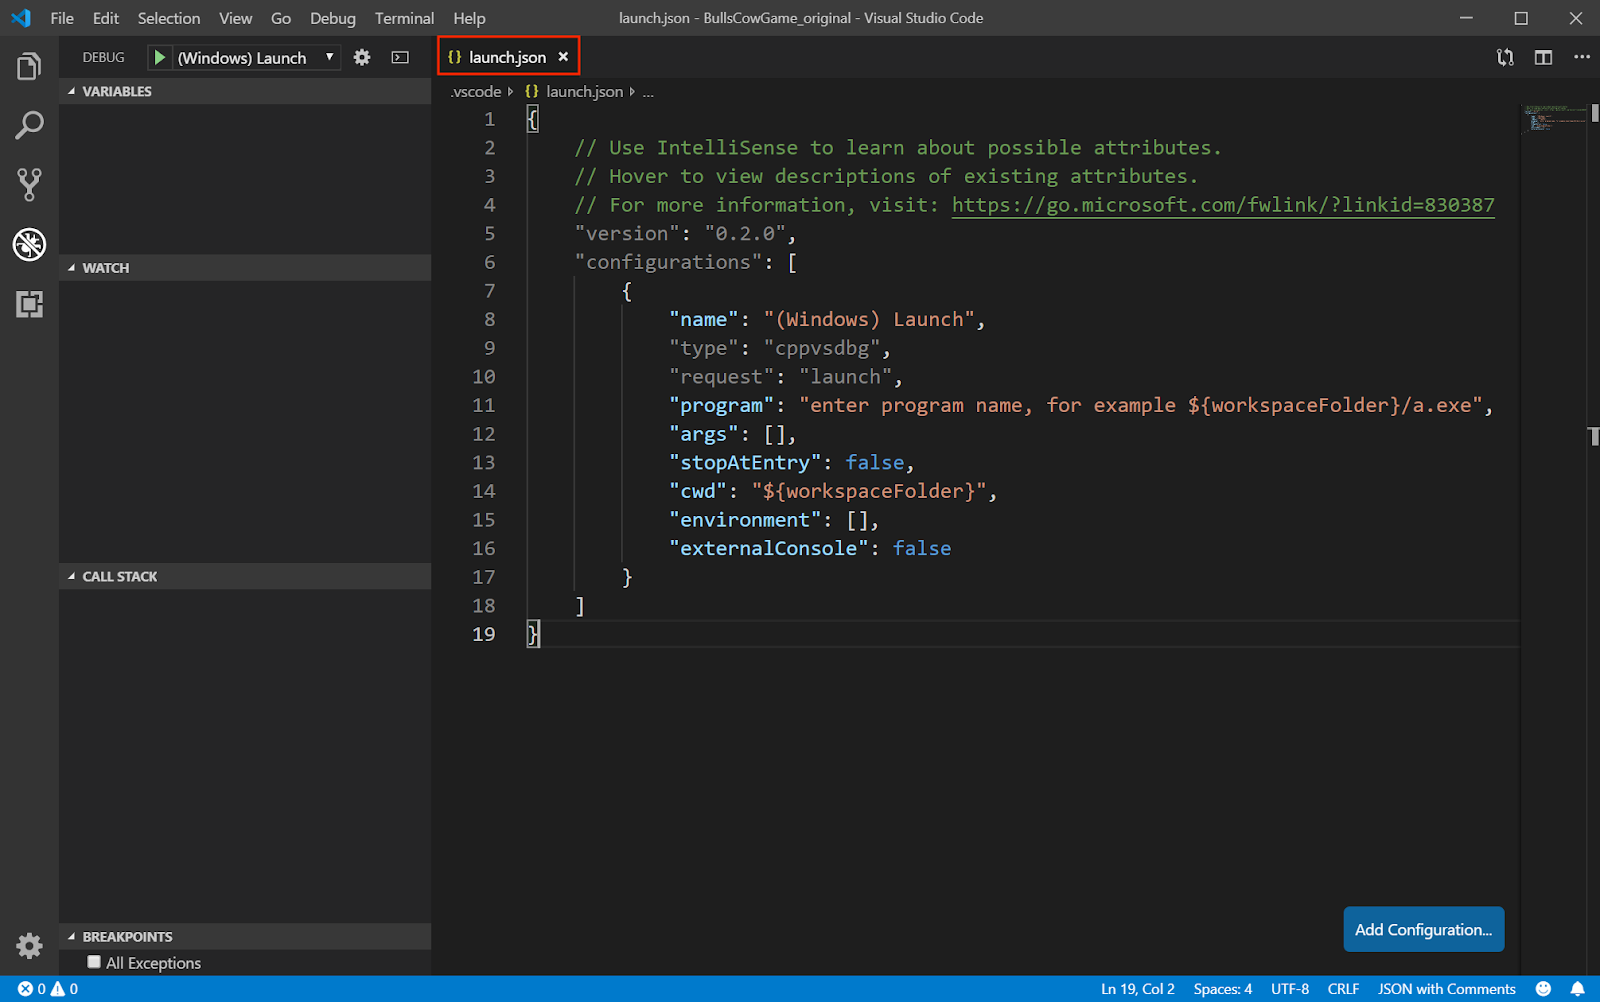
After clicking on “C++ (Windows)” the launch.json file should be created:
The penultimate action is to configure the file.
The only line you have to change is one labeled “program,” otherwise seen as this:
“program”: “enter program name, for example ${workspaceFolder}/a.exe”,
This has to be changed to:
“program”: “${workspaceFolder}/main.exe”,
or the program name you are trying to debug.
Note: <${workspaceFolder}> is actually a variable and nothing has to be changed. What this does is it just calls the folder you are working in (in this case: <BullsCowGame_original>) and uses that as a directory to find the file you are trying to debug.
IMPORTANT Note: Although your file is called <main.cpp> it has to be changed to <main.exe>
- I do not know the reason for this, but I believe it has something to do with that a .exe file is executable while .cpp is not. That’s why the <main.exe> is called the “executable file path.”
Remember to save the configuration.
If you want more information on personalizing the launch.json:
Debug code with Visual Studio Code
Step 4: Debug!
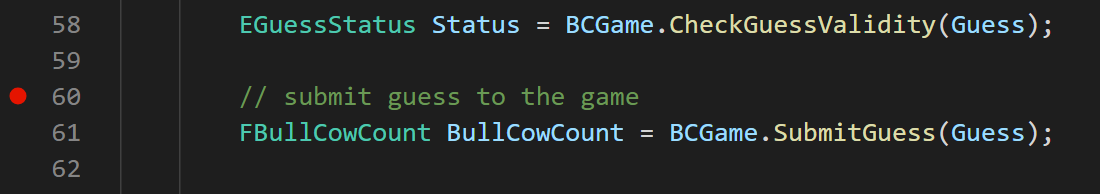
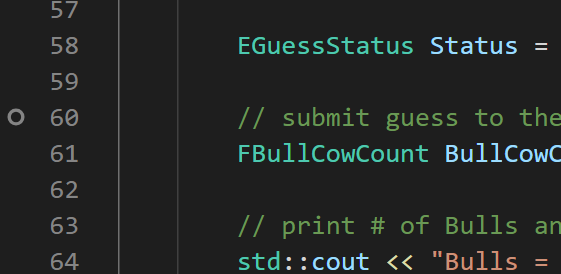
Before beginning to debug, you must add a breakpoint to your code to be able stop the code at any point. It is added by clicking on a line of code to the left of the line-number. The breakpoint shows up as a red dot:
If you want more information about breakpoints, log points, etc.:
Debug code with Visual Studio Code
Debug code with Visual Studio Code
and advanced breakpoints:
Debug code with Visual Studio Code
Now, you can begin debugging by pressing the green play button under the debugging view. It is located to the right of “DEBUG” in capital letters. The launch.json file name (listed as <“name”:> in the file) should show up the right of the play button.
- For example:

- Note: by default the name is “(Windows) Launch” but I decided to change the name to “(Windows) Debugger.” To change the name that appears next to the play button type whatever name you want into the quotation marks to the right of <“name”:> in the launch.json file.
- Ex. <“name”: “(Windows) Debugger”,>
Next press the green button to begin the debugging process.
Once the green button is clicked three things should happen simultaneously.
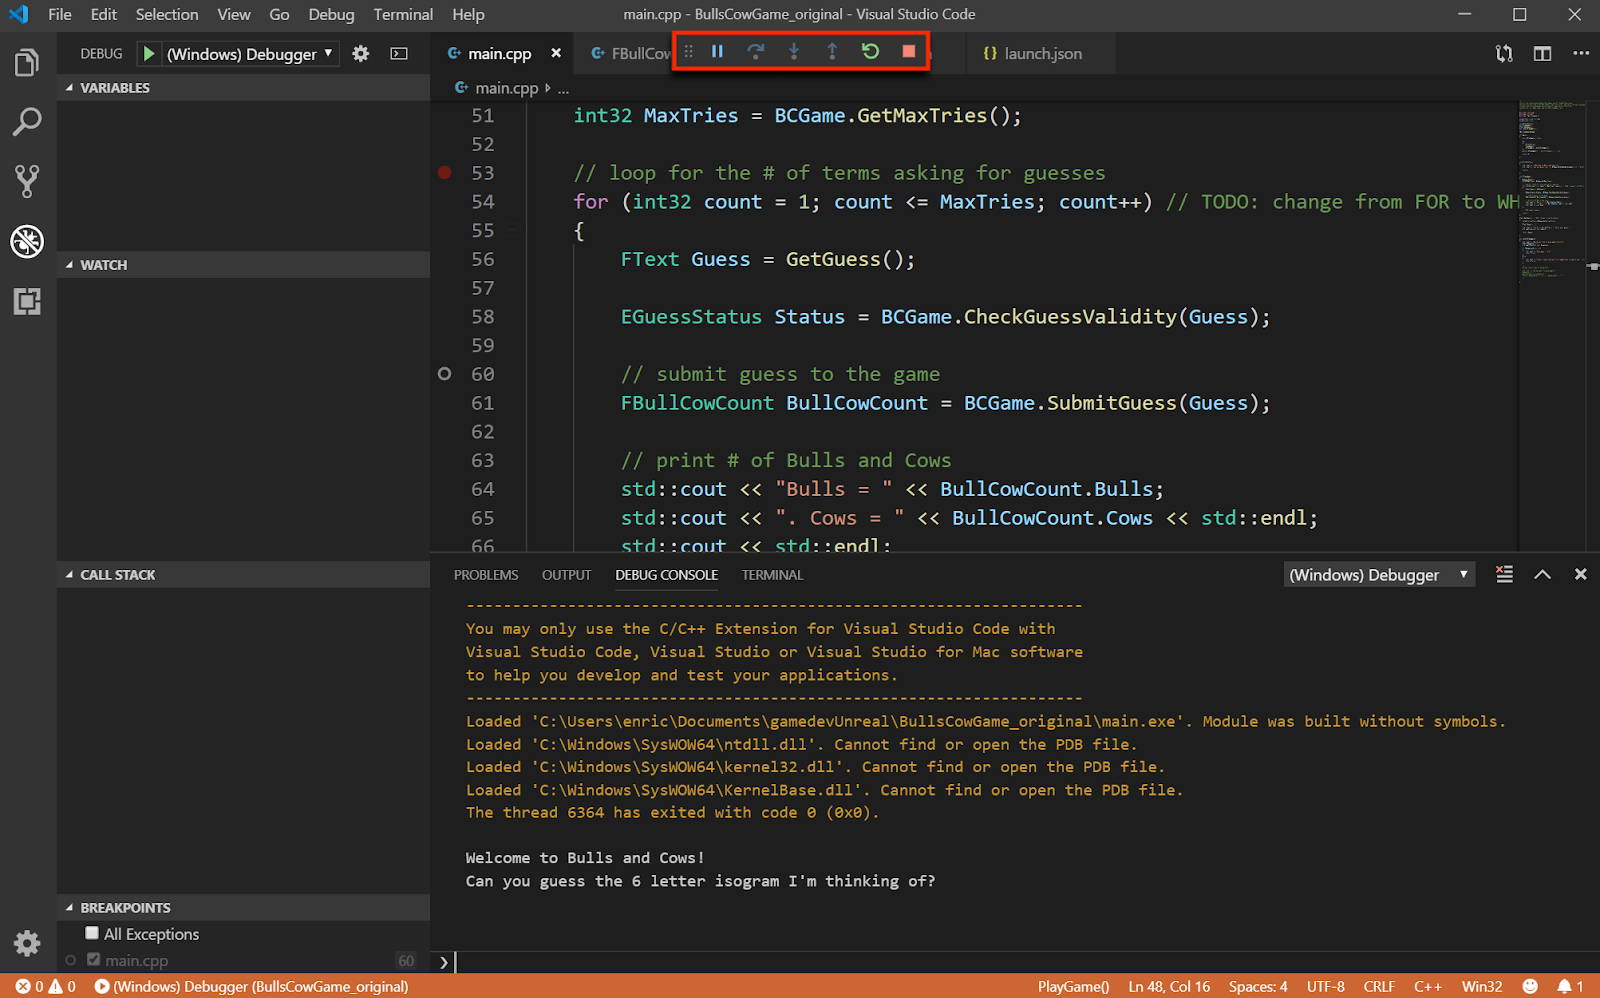
- A bar, like the one shown below, should appear in the top center of the screen. It has six buttons:
A closer view of the bar:

From left to right:
- Continue / pause (F5)
- Step Over (F10) // I don’t know what these do (yet)
- Step Into (F11) // I don’t know what these do (yet)
- Step Out (Shift+F11) // I don’t know what these do (yet)
- Restart (Ctrl+Shift+F5)
- Stop (Shift+F5) - This terminates the debugging session
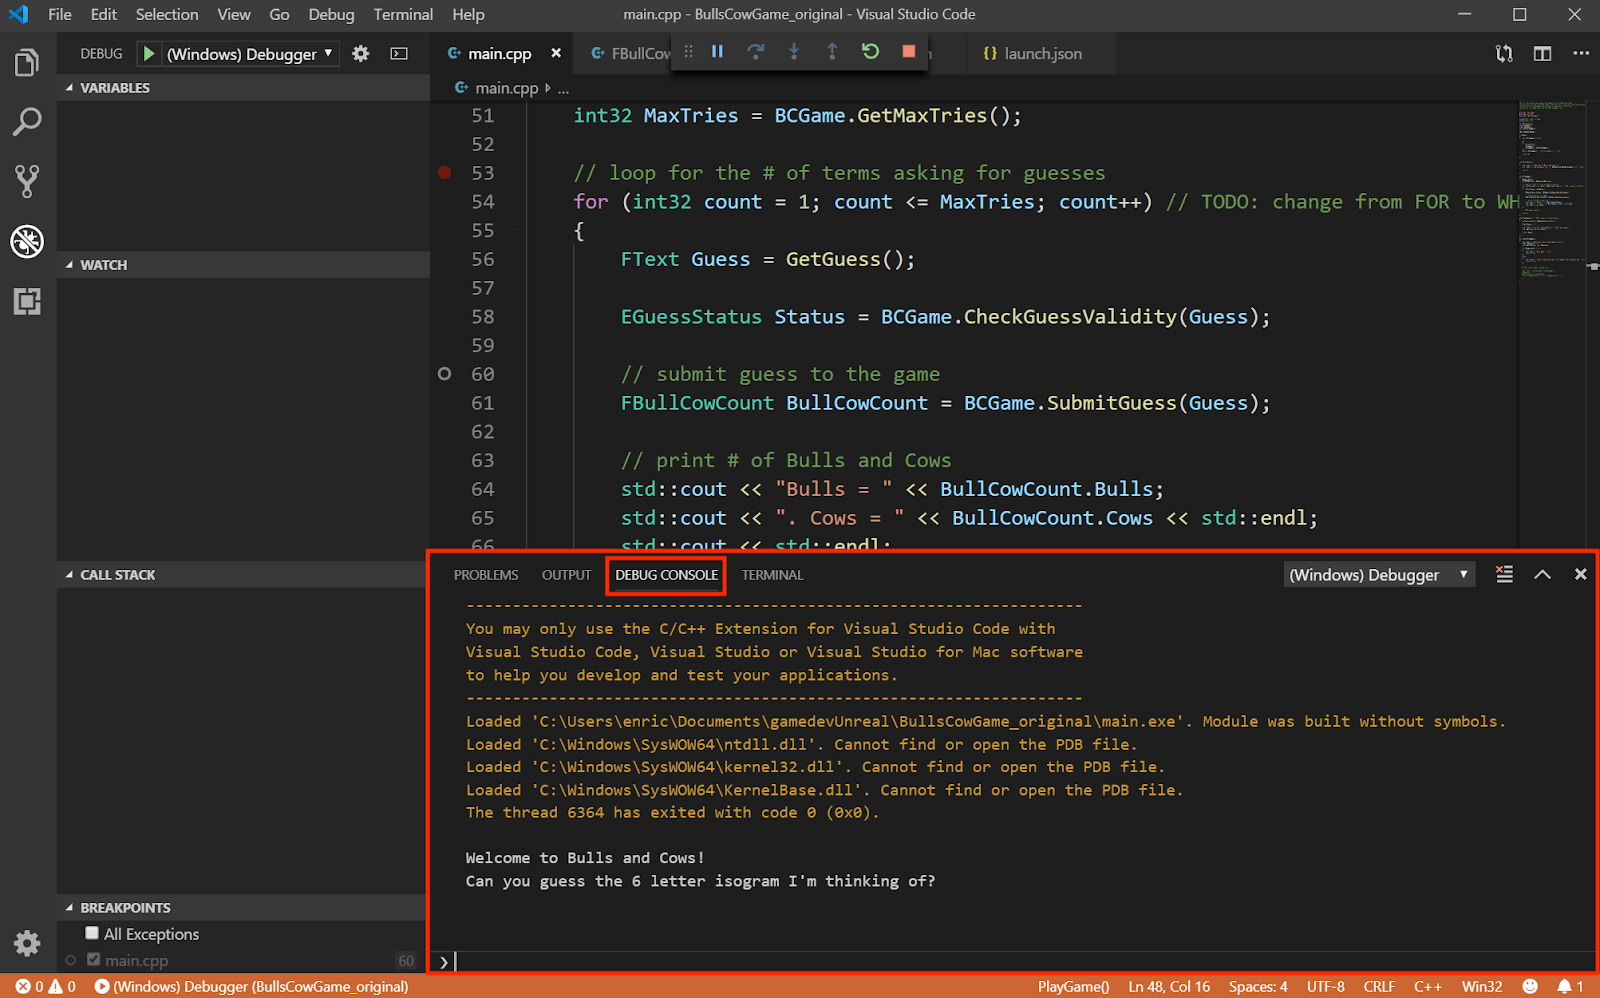
- The “DEBUG CONSOLE” should pop up. It should first appear with some orange text and then begin your program normally.
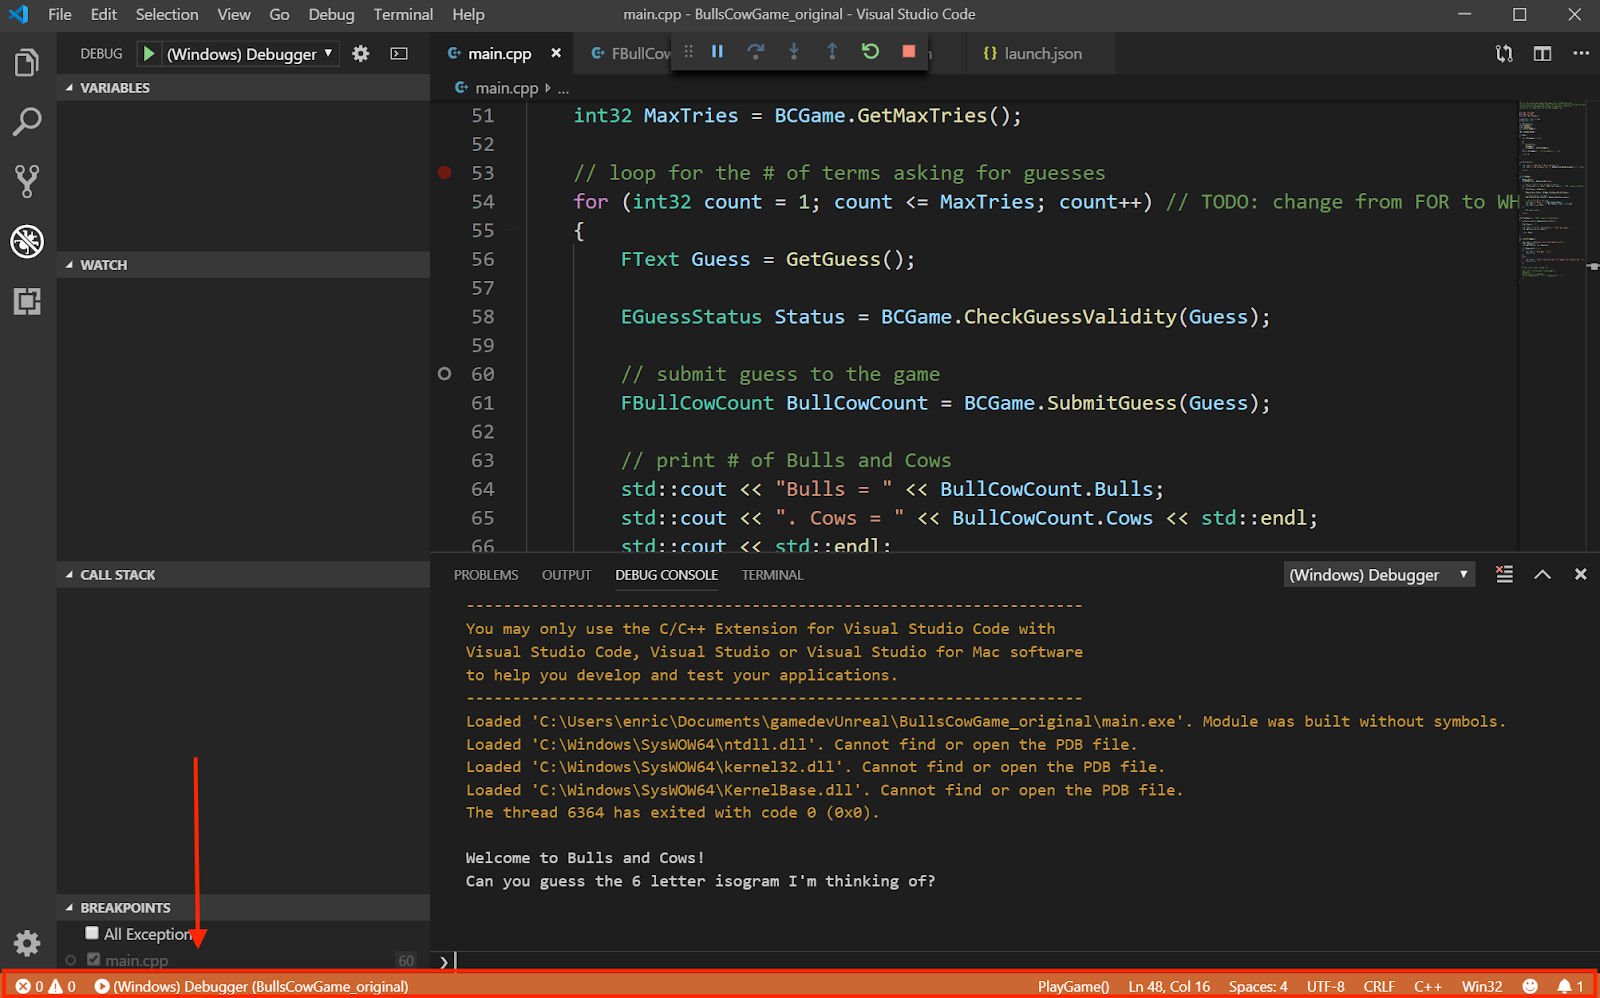
- The bar at the bottom of VS Code, which is normally blue (or another color based on your color theme) will change to orange. On the left hand side will appear the name of your debugger with the folder name in parentheses.
Now you can begin debugging!