
Hello,
this post is related to the unreal courses “A quick look at memory” lecture.
I just wanted to give those who are intereseted some additional look at memory. Hopefully this somehow helps you understand number representation in memory and also how the debugger in VS 2019 can be used a bit better.
Im using the following code:
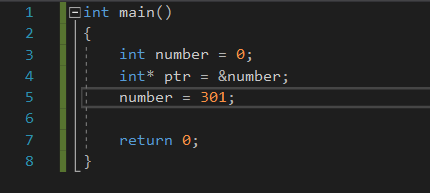
This is from a blank c++ project.
I think most of you should be familiar with what the code is doing.
In line 3 an integer is declared and initialized to 0.
Then in line 4 an int pointer to number is initialized. It cointains the address of number.
Then in line 5 the number 301 is assigned to number.
Debugging - First Steps:
Now lets make a debug point at line 3. To do this double click the mid grey border left of the line number.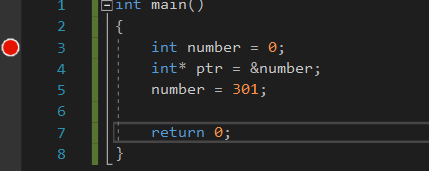
Now check your projects configuration settings in the top toolbar and set it to debug and x86 (blue mark). Then run the program using F5 or the green play button.
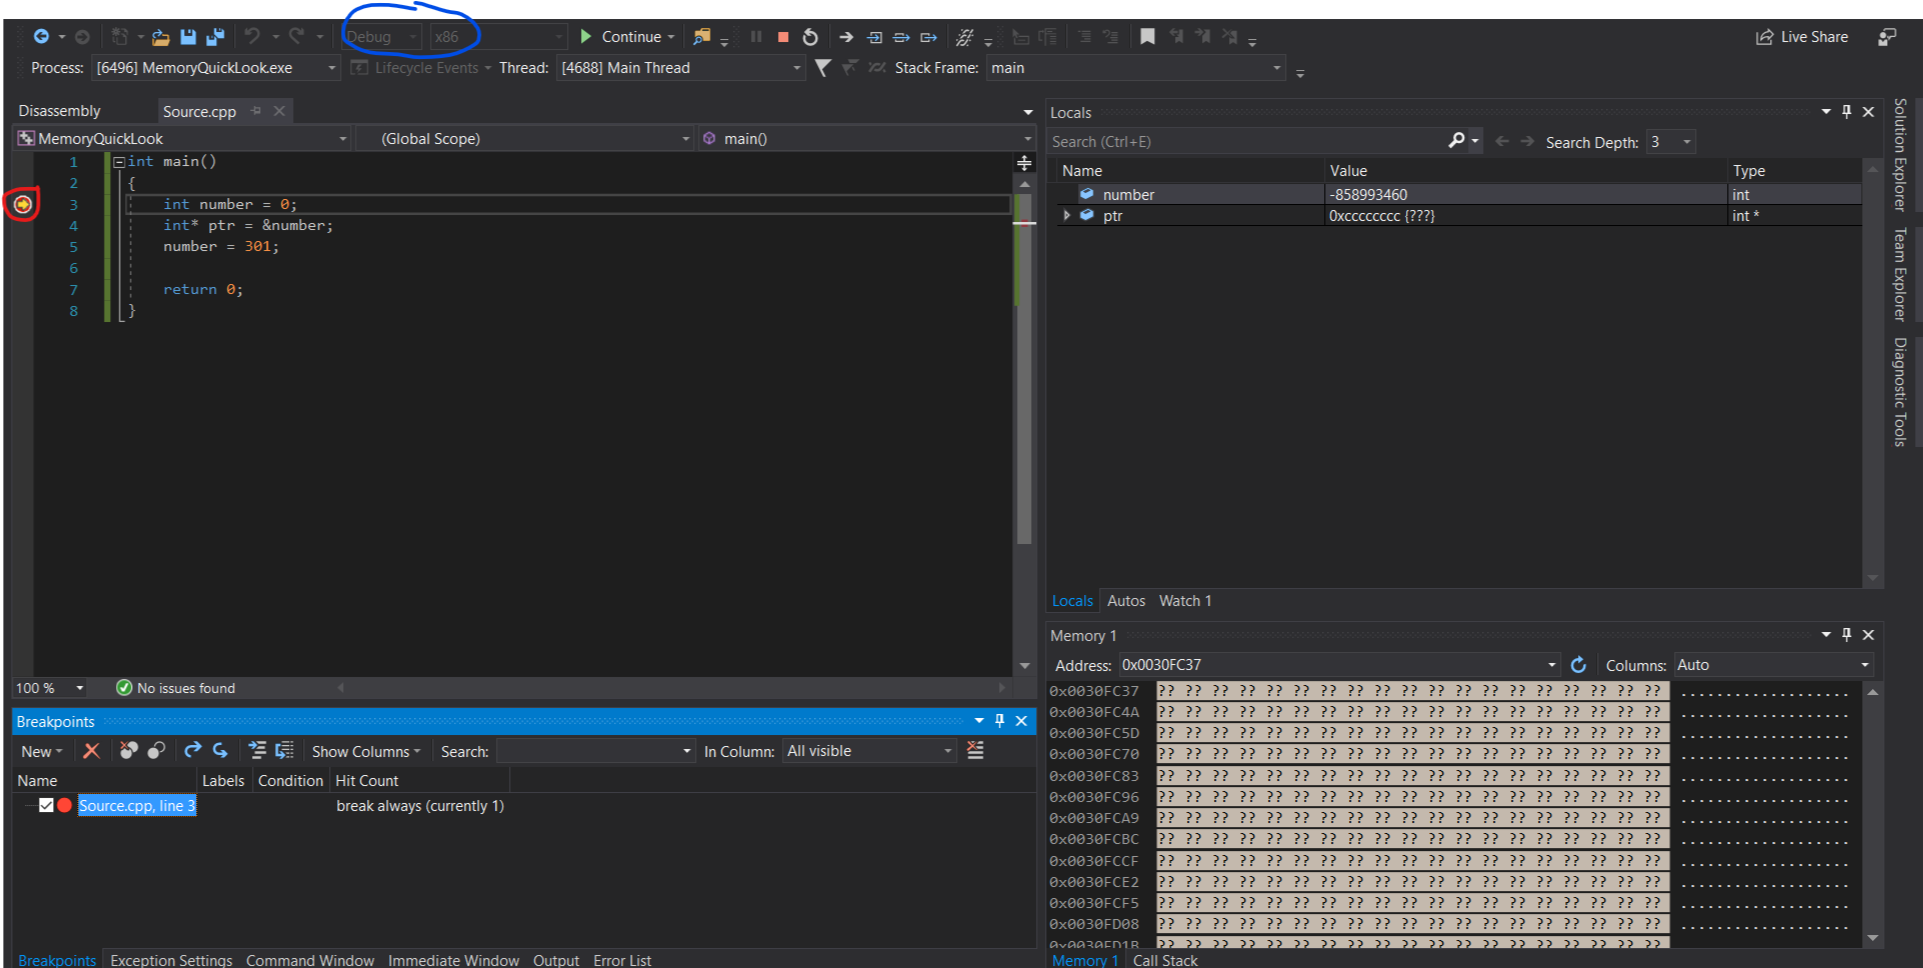
VS will go into debugger view and it will look a bit differently. You might not have the memory window on the bottom right visible if you do not click at the top on Debug -> Windows -> Memory -> Memory 1.
The red point marks our break point. This means that the program stops before the code executes at that line. It also shows an arrow which marks our current position in the program related to the code execution.
On the right side we have a list of the variables in the local scope. number does have some random value because the = 0 operation did not execute yet. the 0xcc is automatically assigned to uninitialized stack memory when debug was choosen in the configuration settings.
We can move forward in our code execution using F11 or F10.
With F11 we move one step forward. With F10 we move one forward but do not step into for example function calls. There are also corresponding buttons to these shortcuts in the toolbar on the right next to the continue button.
Debugging - Going through code:
Press F10. Notice the yellow arrow moving one line down. The previous statement just executed. On the right side number is also set to 0. Changes are displayed in red color. Press F10 again. **ptr** now holds the address of **number**. You can verify this by clicking on watch1 at the bottom then double clicking the light grey line and insert &number. This expression wil then be evaluated. If you do not see Watch1. Click Debug -> Windows -> Watches.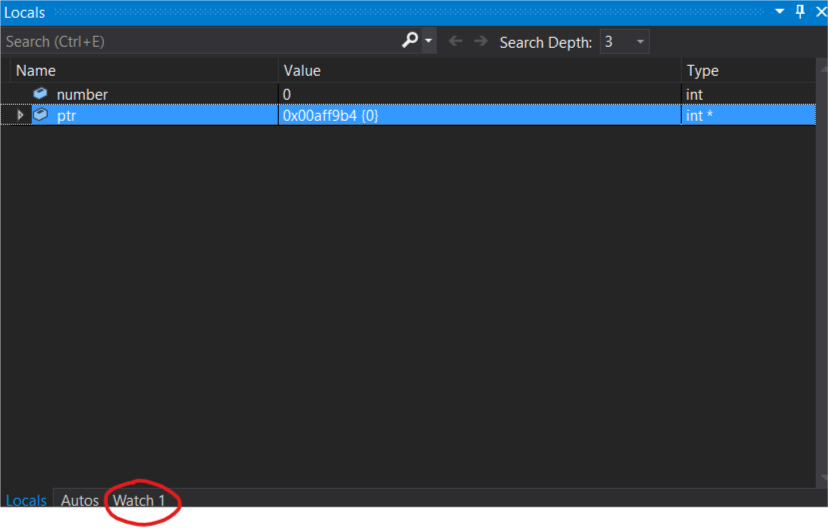
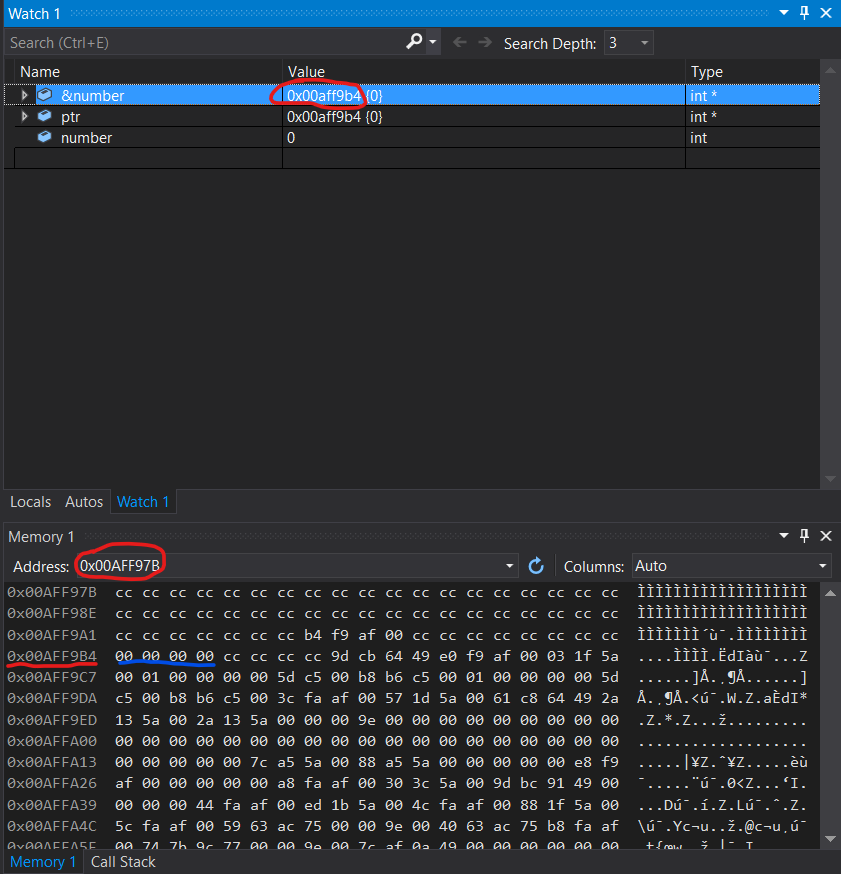
Now lets have a look at the number variable in memory. Copy the value content of ptr or &number and paste the address into the memory view, hit enter.
You will notice that the address on the left of the top row now matches the address of number.
If you like you can also scroll just a little bit upwards.
The address will most likely be different than in this picture. The same happens when you restart your program. So stick with your address values. The memory is displayed in hexadecimal and in byte pairs. This part of the memory is called the stack. It does not include program execution code or variables allocated on the heap. It does include temporary variables for examples number. If the function in which number was declared returns then number will also be cleared in memory.
Likewise if you would call another function in main (DoSomething()) there you declare some variables on the stack. After DoSomething returns those vars are cleared. But there are also some other things stored on the stacks. For example return addresses of functions.
Hexadecimal representation:
Hexadecimal ranges from 0 - F in numbers this maps to 0 - 15. 2 hexadecimal numbers represent 1 byte. FF is the biggest number which is 255 that can be represented with one byte. For example the 00 or cc is one byte. 00 equals to 0 in decimal and CC equals to.C * 16 + C * 1
= 12 * 16 + 12 * 1
= 204
As you can see the number variable has stored a 0 in memory (blue mark). How do we know the 4 byte pairs represent the number? We can assume this because we used debug mode and x86 as configuration. with these config the vs compiler usually makes int 32 bits == 4 bytes big.
Now lets stept on step forward with F10.
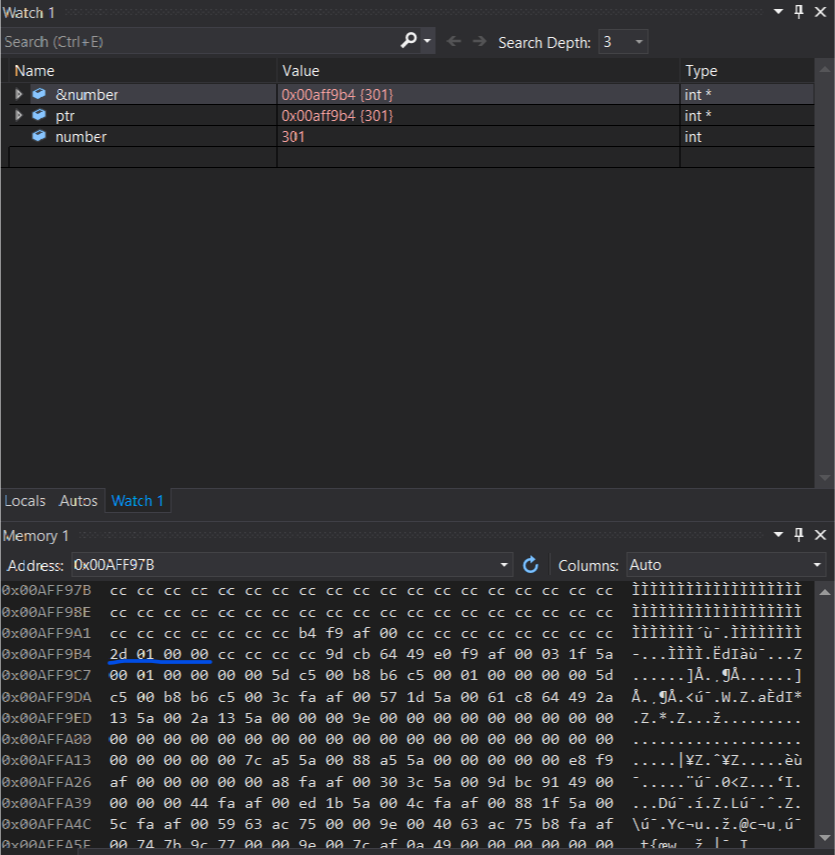
number changed to 301. And the memory contents also changed. --> 2D 01 00 00
Converting from Decimal to Hexadecimal:
Now lets do some number bases conversions to check this. First lets convert 301 into binary.301 / 2 = 150 Remainder: 1
150 / 2 = 75 R 0
75 / 2 = 37 R 1
37 / 2 = 18 R 1
18 / 2 = 9 R 0
9 / 2 = 4 R 1
4 / 2 = 2 R 0
2 / 2 = 1 R 0
1 / 2 = 0 R 1
Take the remainders from bottom to top. Bottom is the highest bit.
1 00101101
Fill with 0s on the left to match 32 bit number.
00000000 00000000 00000001 00101101
and convert to hexadecimal. This is done by mapping 4 bits to 0 - F:
00 00 01 2D
and lets look what was displayed in the memory view:
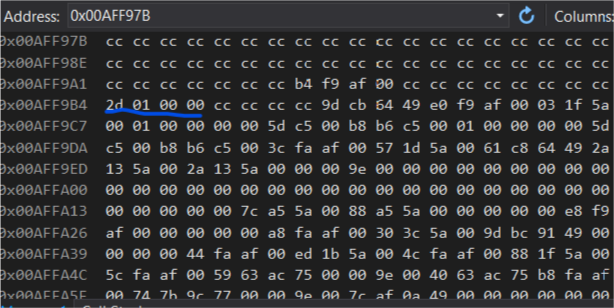
Well this does not look the same but the individual numbers do.
This is caused by something called endianness. Endianness is the order of bytes or bits within a number representation. When doing operations by hand like we did the conversion, it is usually done using big endian ordering. x86 compatible machines use little endian. The order is reversed. When looking at bytes it is bytewise reversed.
00 00 01 2D --> 2D 01 00 00
A look at our pointer:
Lets have a look at the row above the address of **number**. In the Picture its address 0x00AFF9A1. Its all CCs except something in the middle. B4 F9 AF 00. This is actually the value of our pointer to **number**. Keep in mind this is little endian representation. 00 AF F9 B4 (keep in mind you may have different addresses). Looks familiar right? Its the address of **number**. But whats the address of the pointer? Well we can simply count beginning from 0x00AFF9A1 until B4 --> its 8 bytes. The first CC is the address 0x00AFF9A1. This means the pointer has the address 0x00AFF9A8. Lets check by adding &ptr.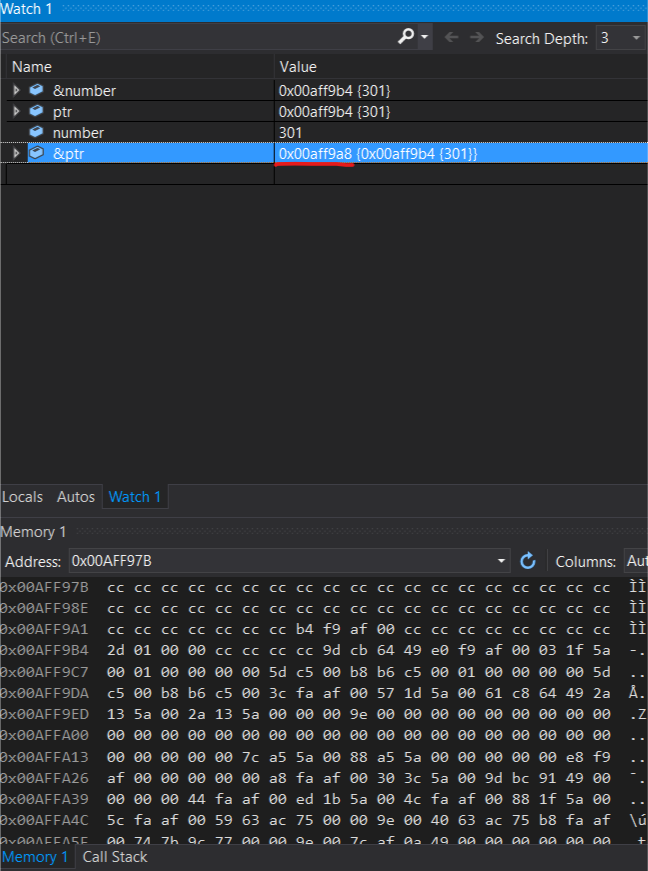
One more thing:
So far we looked at the stack. But we can also have a look at the instructions. For this right click the code view and click on go to disassembly. Lets look at the number = 301; line below the line the diassembled code is shown.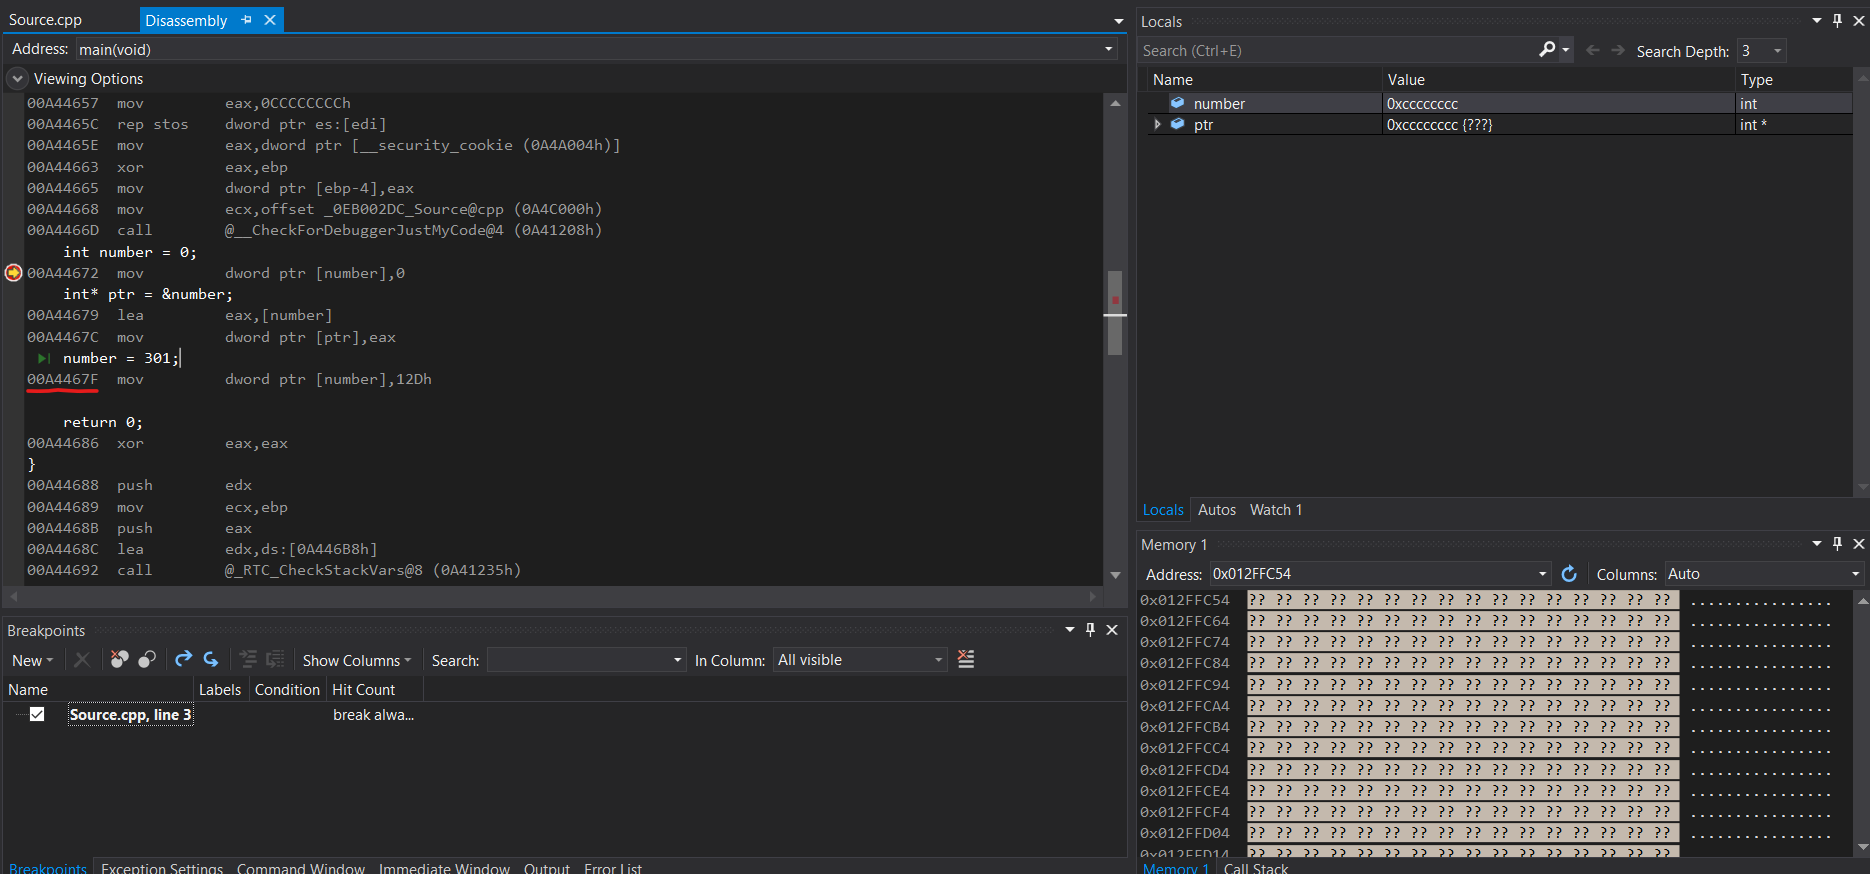
The marked address is the address with instructions for this assignment. You can look it up in the memory view. What you see is the bytecode of this line. You can also show the bytecode by right clicking in the code view and select show code bytes.
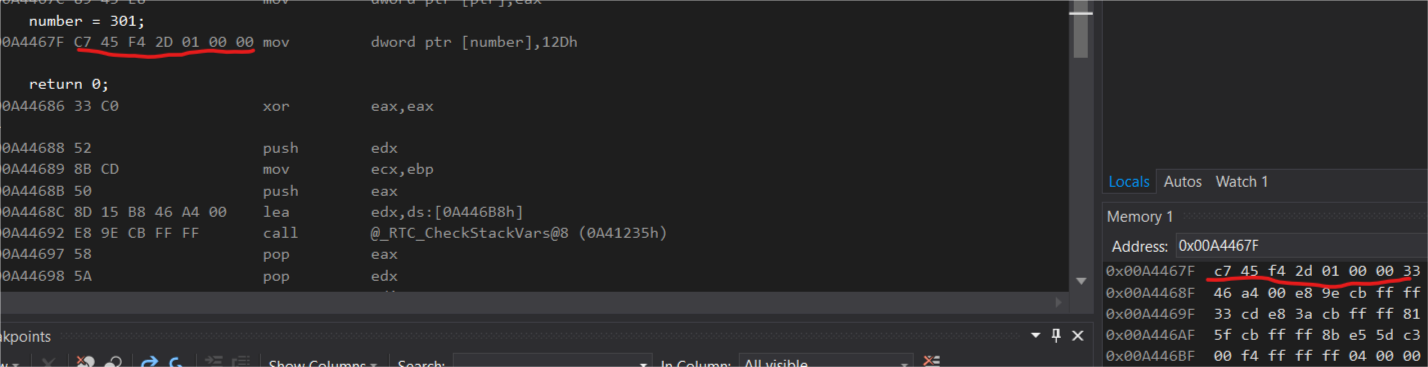
Notice the 2D 01 which is the number 301 in hexadecimal. To actually interpret the bytecode you have to look up the CPUs intrusction manual.
With this information we can do one more thing to get a bit more familiar with bytes and memory.
Consider the following program:
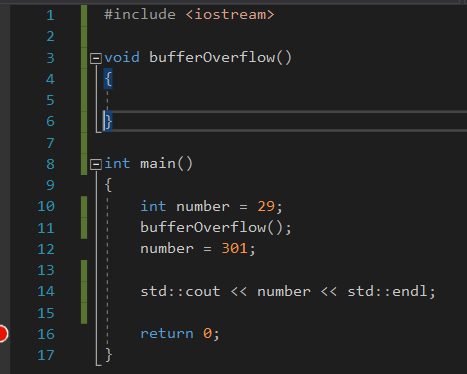
If you run this without debugging then 301 will be printed.
Lets try to skip the number = 301; assignment
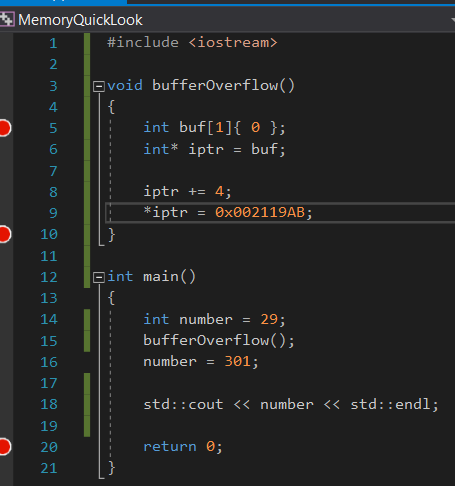
Add some code to the bufferOverflow function.
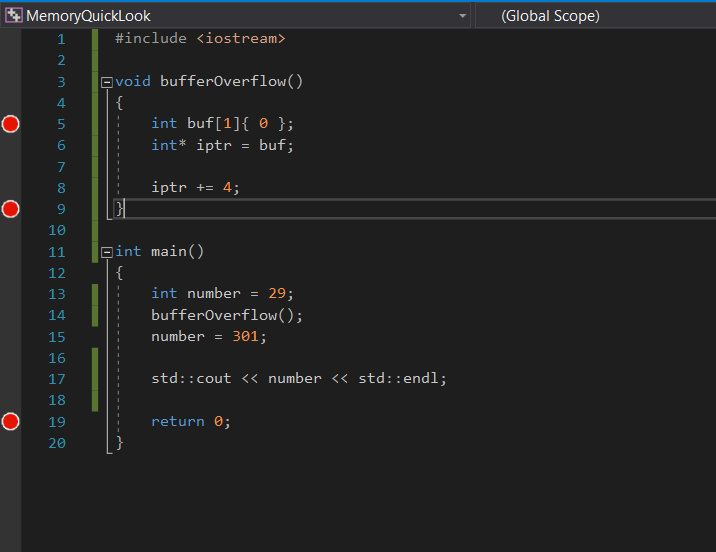
What we need to do is to modify the return address of this function in such a way that it will not return at line 15 but skip that.
To do this we initialise an int array one element big (32 bits == 4 bytes) with 0. Actually its not important to initialise it with 0s but its easier to read the memory.
Then in line 6 we declare an int pointer pointing to the beginning of the array (first element). Now what we have to do is to offset the pointer to point to the return address of the function in memory.
The return address is located at ebp (base pointer) + 4 bytes in x86 systems.
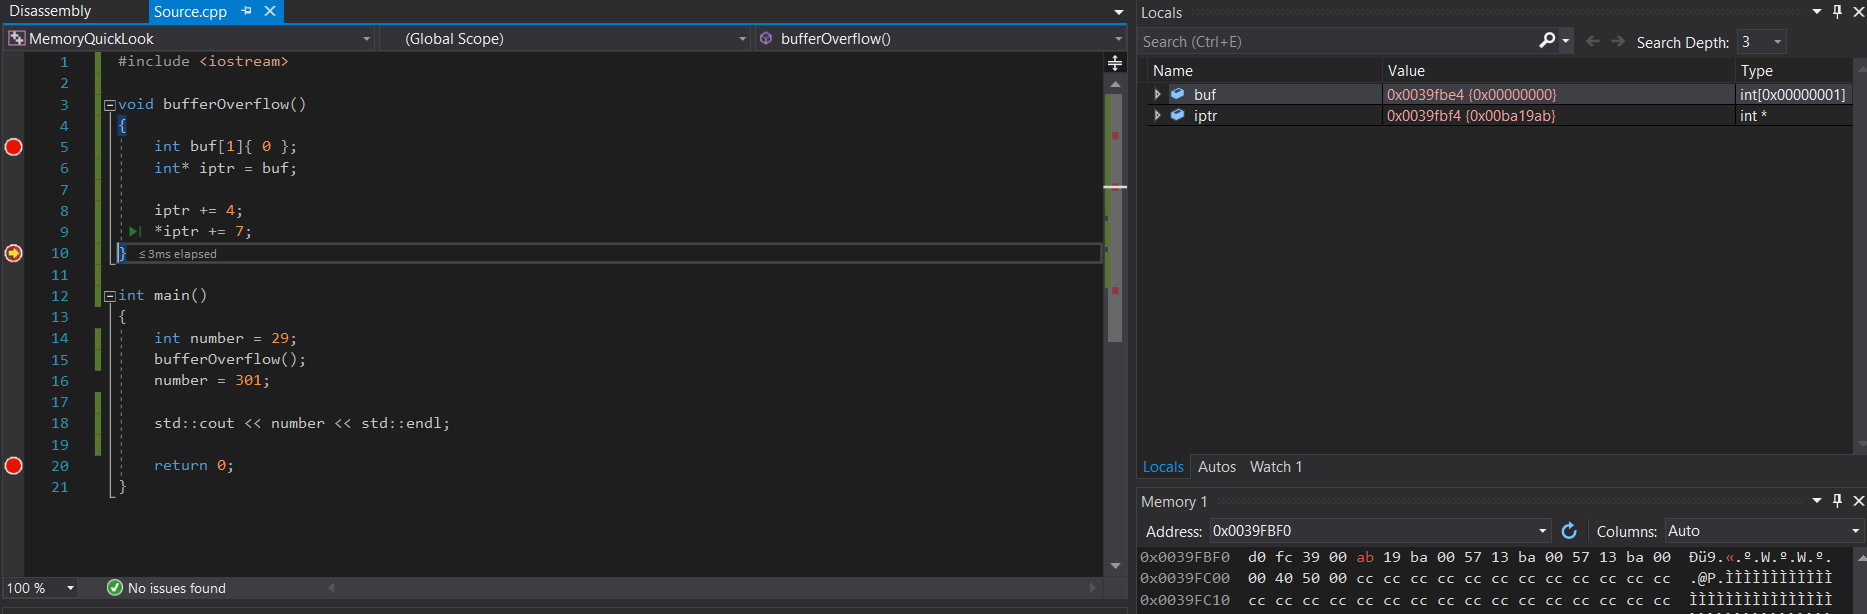
I make some additional breakpoints to follow the execution a bit easier and start debugging.
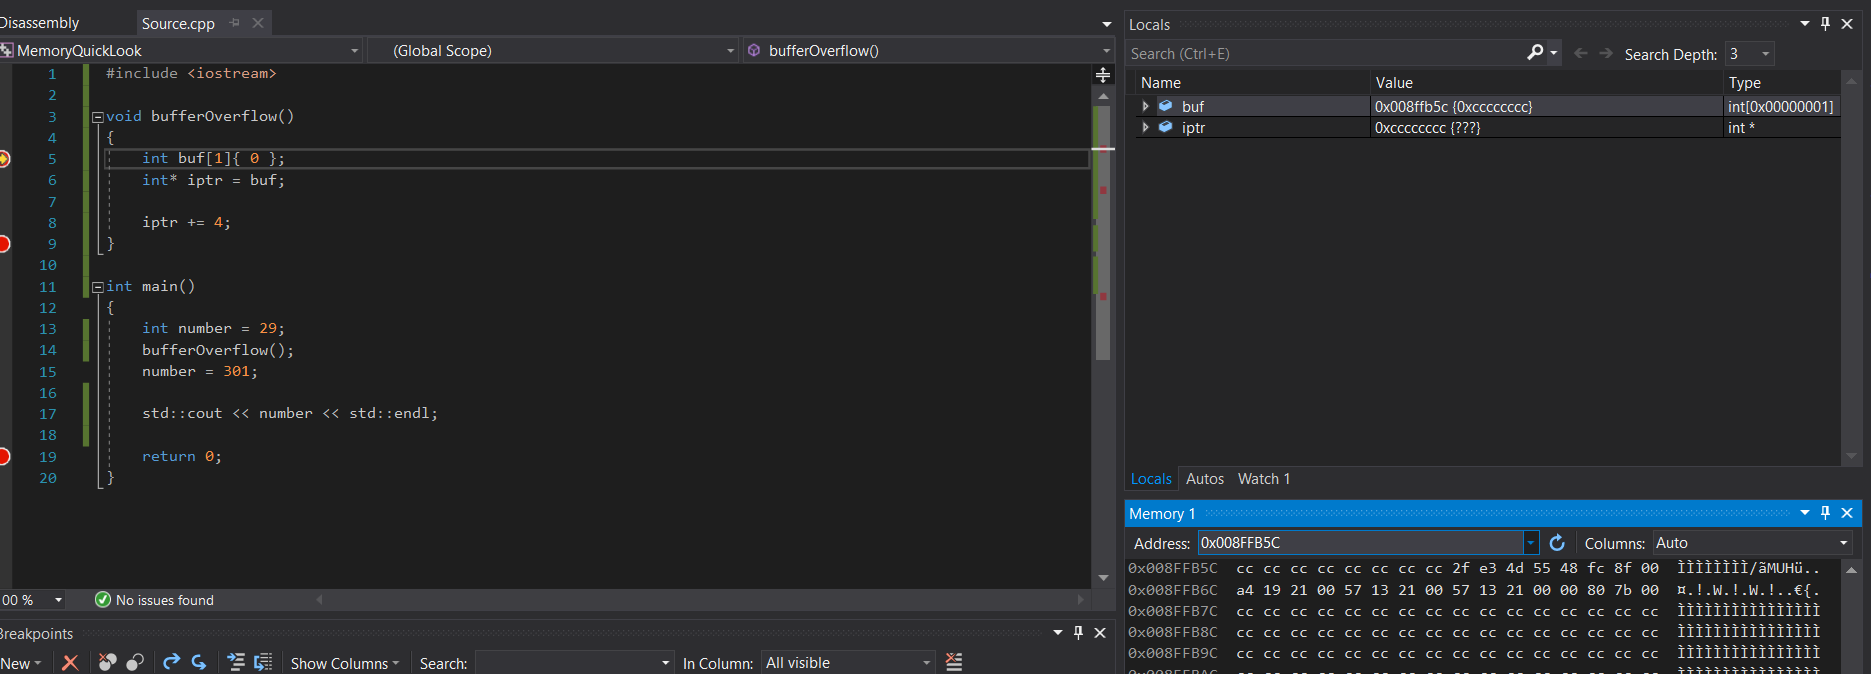
Insert the address of buf into the memory view. Keep in mind addresses may be different. Its cccccccc which means its uninitialized. By pressing F10 you can notice how the array is initialized to 0es.
Instead you can also click on continue and get immeadiately to the next (2nd) breakpoint at the end of the function.
Like I already said the return address is located at ebp + 4.
We can look up the base pointer by simply inserting ebp into memory view.
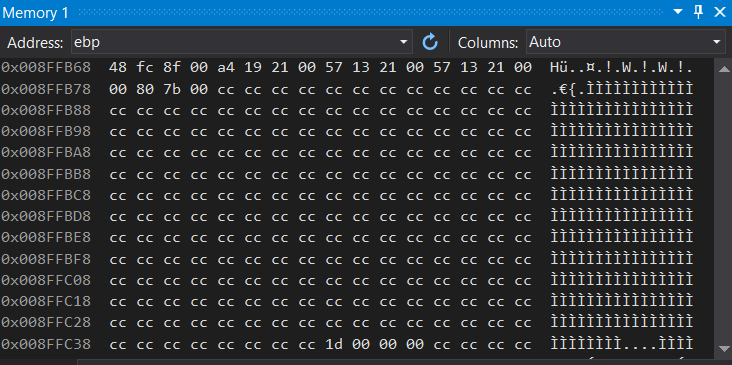
Moving 4 bytes forward the return address contains 0xa4192100 or 0x002119A4 in big endian. This means when the function returns the program resumes at address 0x002119A4. We can double check this by looking at the first instruction address of line 15. Which is the next line after the function call.
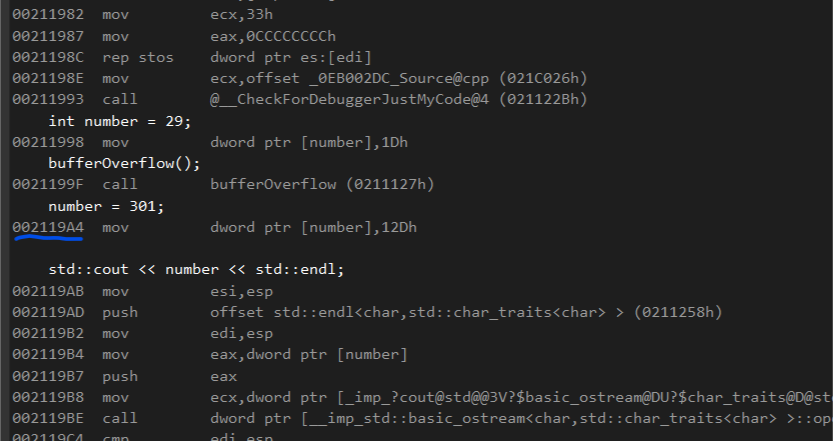
So far, so good. We can also see that we have to jump to 0x002119AB in order to skip the assignment.
So what we still have to do is to move the pointer to ebp + 4 and change the return address.
Now what does the iptr += 4; do?
This moves the pointer
4 * sizeof(int)
= 4 * 4 bytes forward which is 16 bytes in total.
If this would be a char pointer this would move it 4 * 1 bytes in total.
iptr += 2 would have moved the pointer 2 * 4 bytes forward.
I decided to use an int pointer because the return address in x86 systems is 4 bytes long so we do not have to do some casting operations when dereferencing the pointer which would make the code a bit more complex.
Looking at our locals we can see that iptr points to address 0x008ffb6c after reaching the 2nd break point at the end of the function. The content is 0x002119a4.

This is exactly ebp+4. The value of ebp is marked in green. The memory also illustrates that if the pointer is pointing at buf (0x008FFB5C) we have to move it 16 bytes forward in order to point to the return address. Im not quite sure what the 8 bytes between the end of buf and ebp are. Maybe this has to do with alignment.
The only thing left is to change the 4byte return address. This can be done by dereferencing the pointer and assigning a new value.
However this most likely will not work. Because every time you restart the program the addresses may change. We can do better. Instead of assigning a fixed address we can calculate the offset of the instruction addresses of number = 301 and the cout instruction and add this offset to the return address. We already know the needed addresses. If you like you can add a watch to compute the result.
0x002119AB - 0x002119A4 = 0x00000007
This means we have to add 7 to the return address.
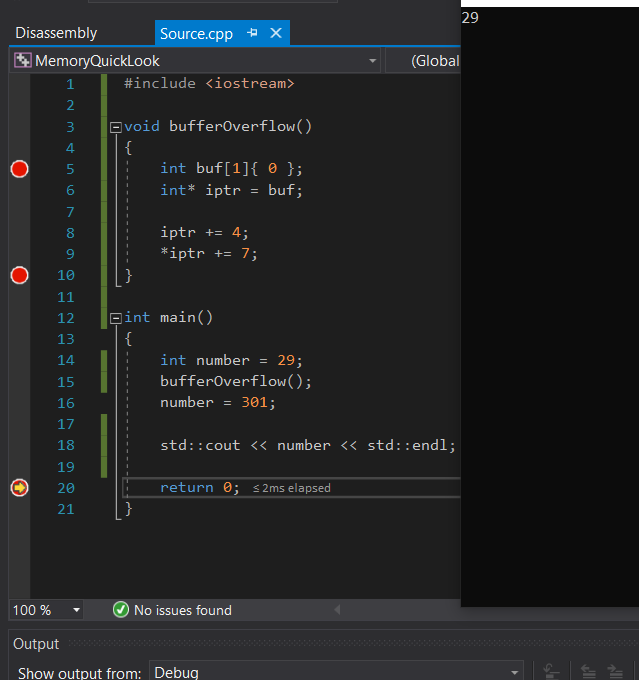
Start debugging, look for ebp in the memory view and click continue and notice how the return address changed (red highlight).
Click continue again and look at the console windows output. Its 29.
Actually this is not an buffer overflow because a pointer was moved and dereferenced to change memory. But instead you could also ask the user for input and copy this into a buffer without doing any security checks. If the buffer is too small it will overflow and if done right the input is big enough to offset till the return address and overwrite it.
I hope that these things helped to understand memory and how bytes are represented and related to it a bit better.