Profile Statistics

Hi. I have strange stats in profiler and it would be nice, if anyone could explain me, why it going this way.
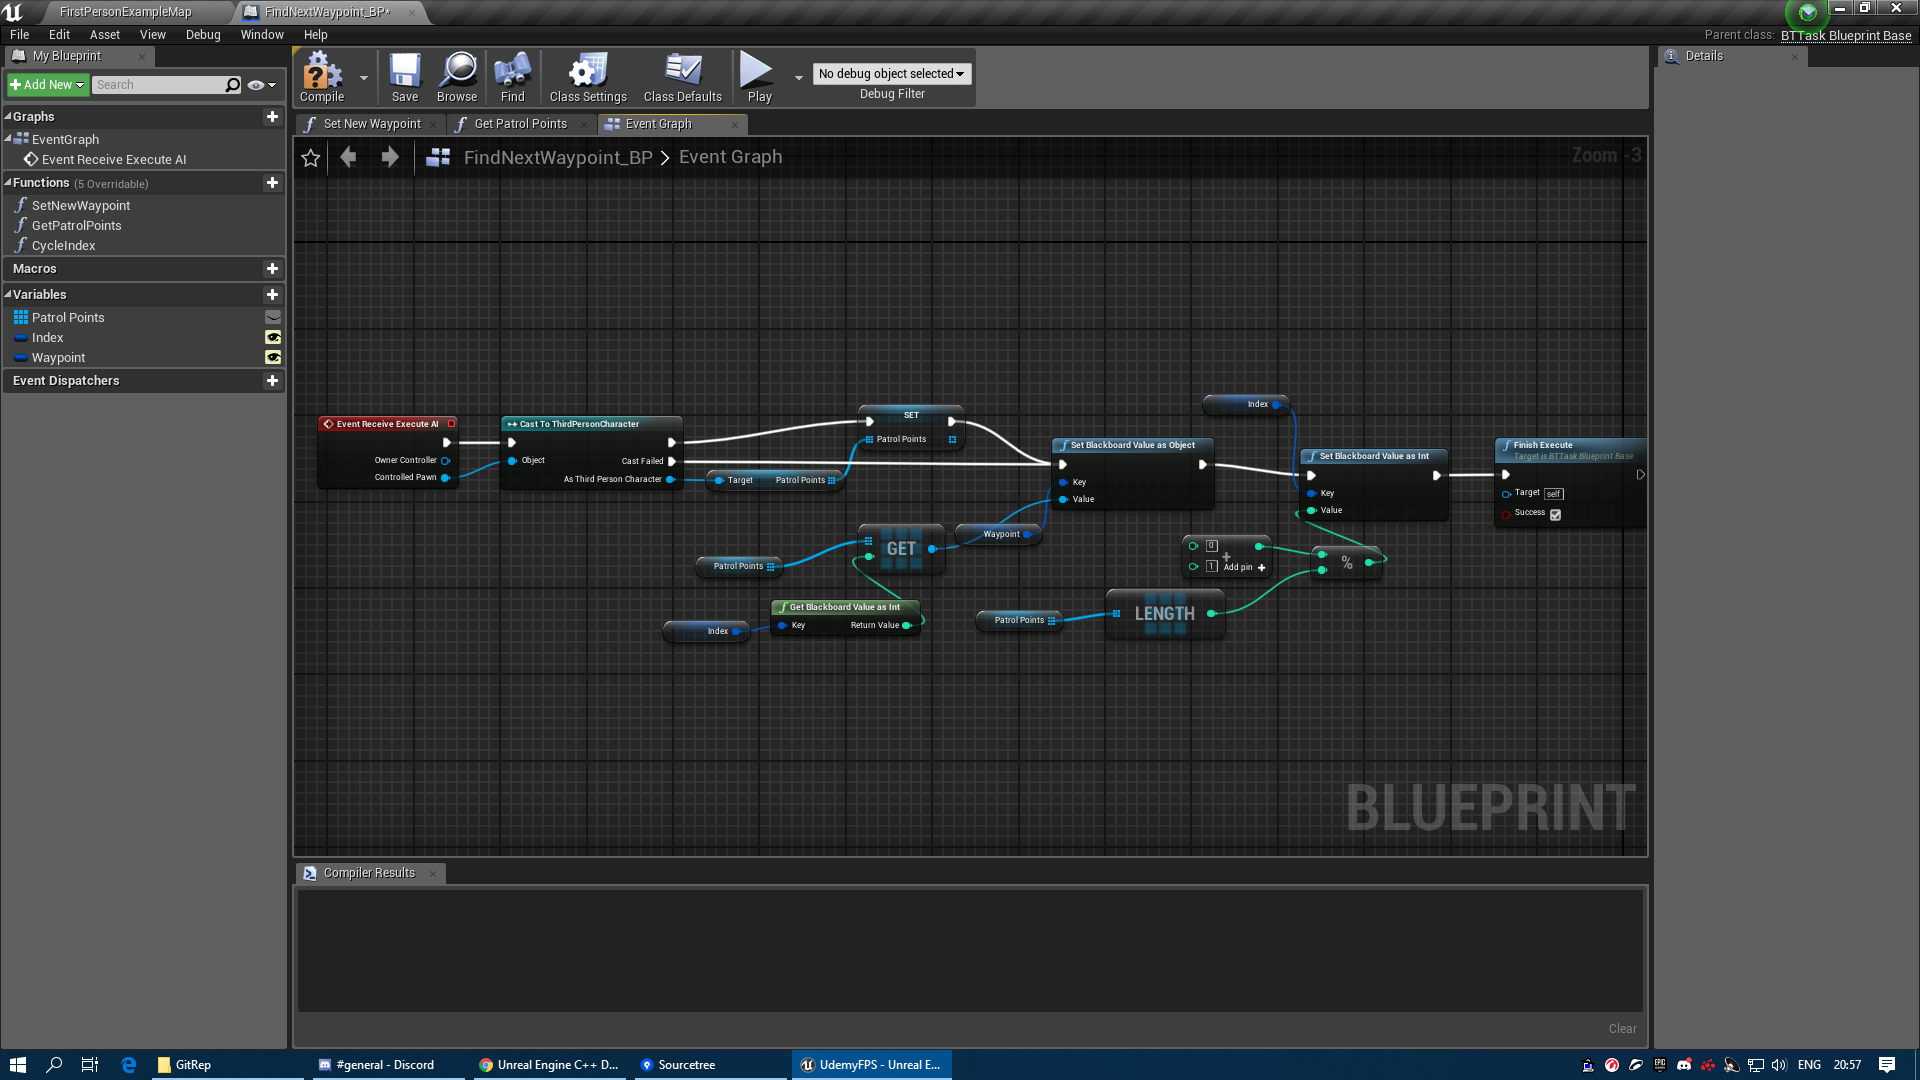
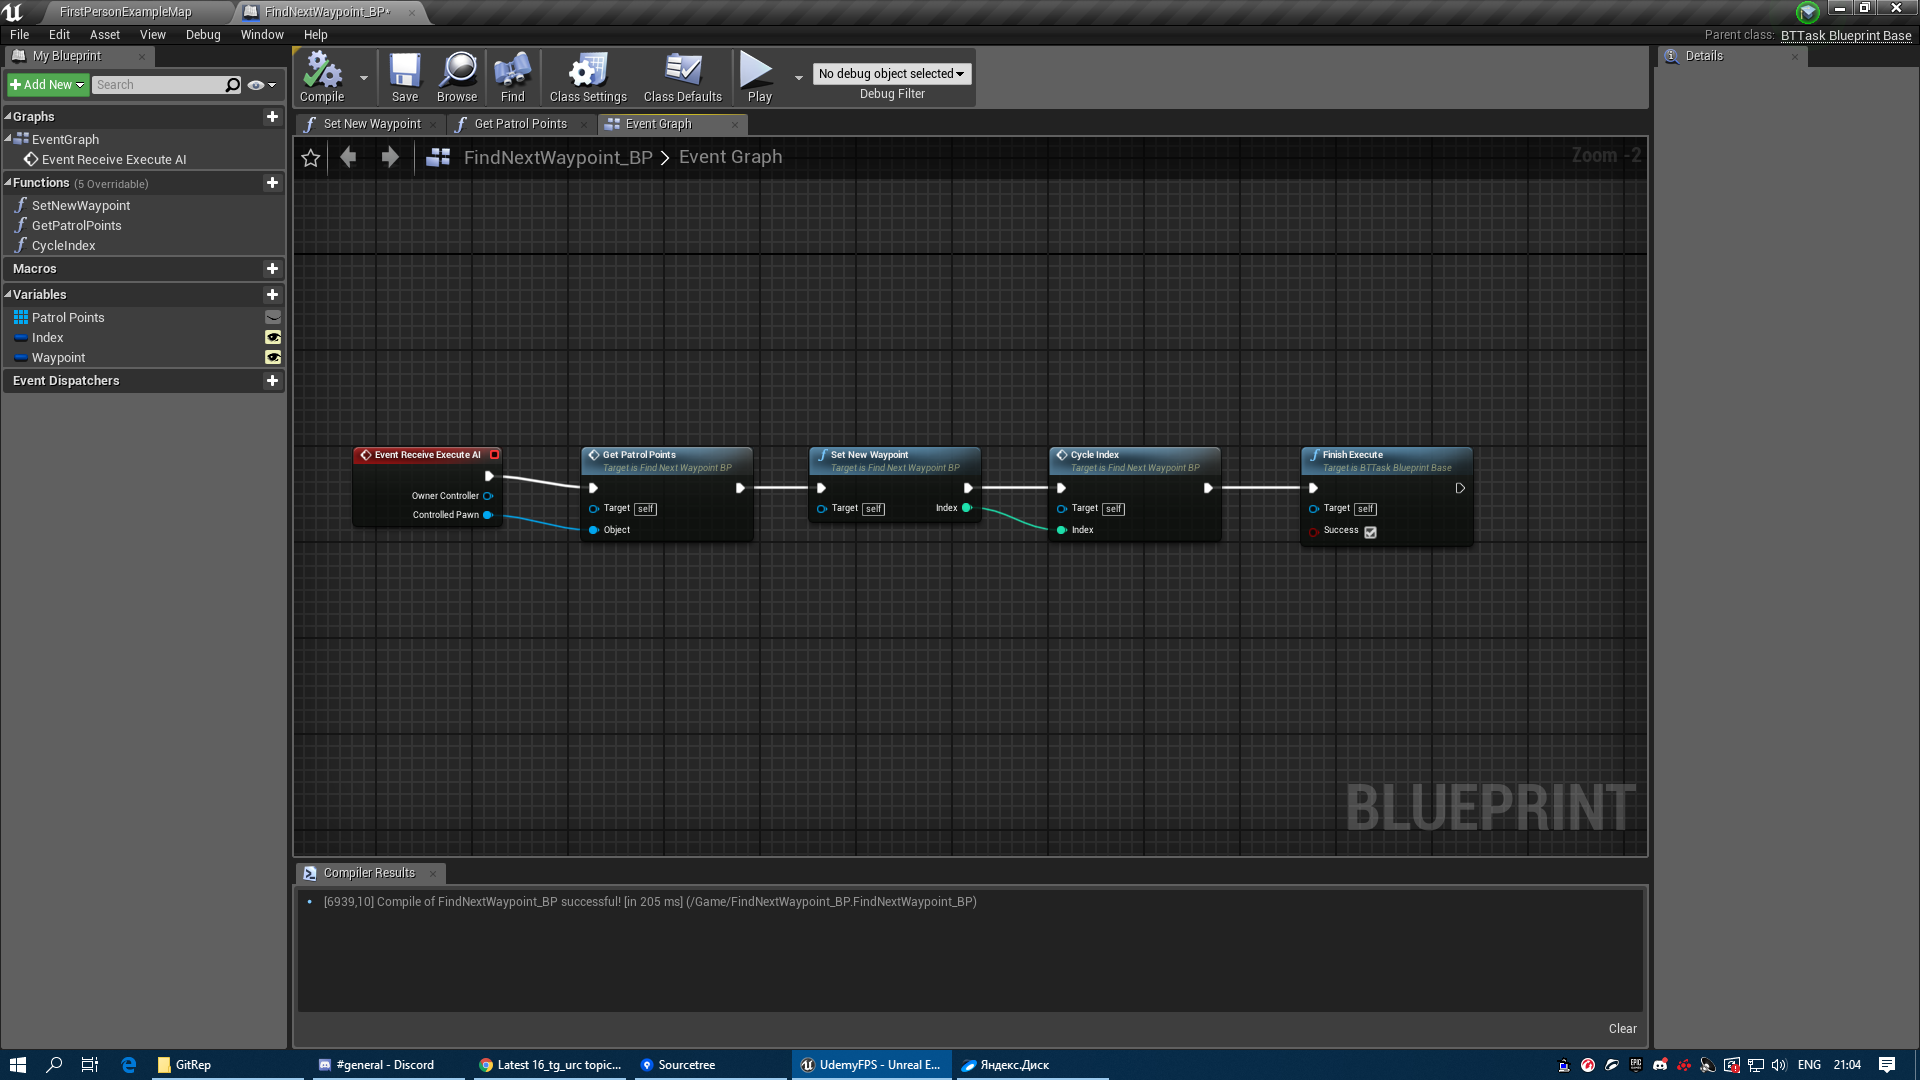
my expanded BP scheme:
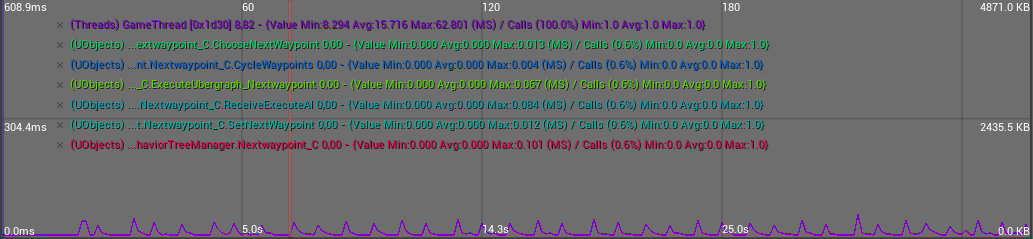


Profiler:

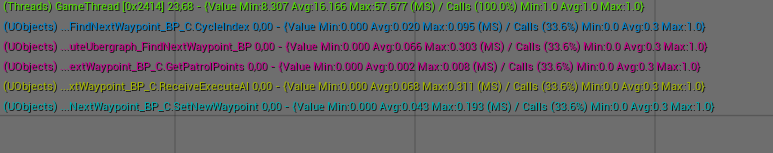
Field “Calls” has value 33.6%, while in course it has value “0.3%” . Difference like 100 times. Average/Max time in MS is also too high.
My CPU: Ryzen 5 1600
GPU: radeon R9 290
RAM: 16 Gb
with ~16 average ms at main thread i calculated 60(fps)* 0.311(calls %/ 100) = ~20 times per second it’s updating AI, this is 100 times frequently that in course video, where u have about 0.231 Ai update/sec.
I really want to understand, what’s going on. Help me pls, if u can and have a time.

This might be because of how it’s called. What does the Behaviour Tree look like.

It looks like in u’r video. Absolutly the same.ChooseNextWaypoint>>>Move To in Sequence. I

Can you post screenshots? Been a while since I did the videos and it helps to double check anyway.

Now i am at 30+ lections further and BP Task was deleted 5 days ago cuz of refactoring. But i did it again from scratch with new character BP (UE4ASP_Character) and now it has nice values like “Calls (0.6%)” and low ms values. IDK what it was, but now everything is ok.
image
Thank you for answer, but idk, how can i reproduce this bad case with 33.6%. So, cant see the reason to continue discussion with that.
Have a good day, Sir.

1 Like

This topic was automatically closed 24 hours after the last reply. New replies are no longer allowed.

Privacy & Terms