In this lecture we learnt how to plot our graphs for currentFuel / time.
How did you get on with drawing the line for when maxFuel = 150 and burnRate = 3. Did you notice anything interesting in relation to the other lines we plotted?
In this lecture we learnt how to plot our graphs for currentFuel / time.
How did you get on with drawing the line for when maxFuel = 150 and burnRate = 3. Did you notice anything interesting in relation to the other lines we plotted?
It was double the orange line and triple the red line.
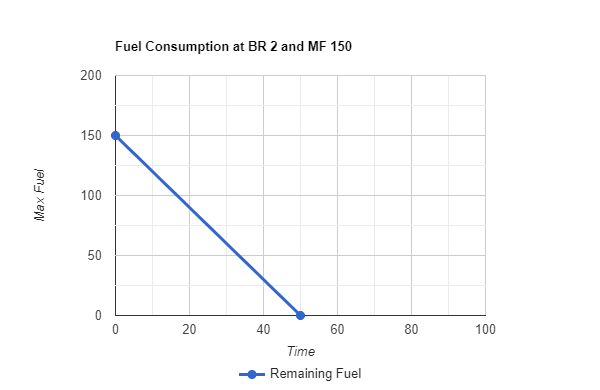
At t = 0, m = 150.
At c = 0, t = 30.
So since when t = 0, c = m
When t = 0, c = 150
Since t = (m - c) / b
When c = 0, t = (150 - 0) / 3
So when c = 0, t = 50
Again, the tank lasts 50 seconds. So no matter how much we multiply the original maxFuel (100), if we also multiply the burnRate by the same amount it will last the same time.
I noticed that the gradient of each plotted line is equal to the burn rate.
It made sense based on the ratios of the previous but I did the math anyway for pratice
I got t = 50
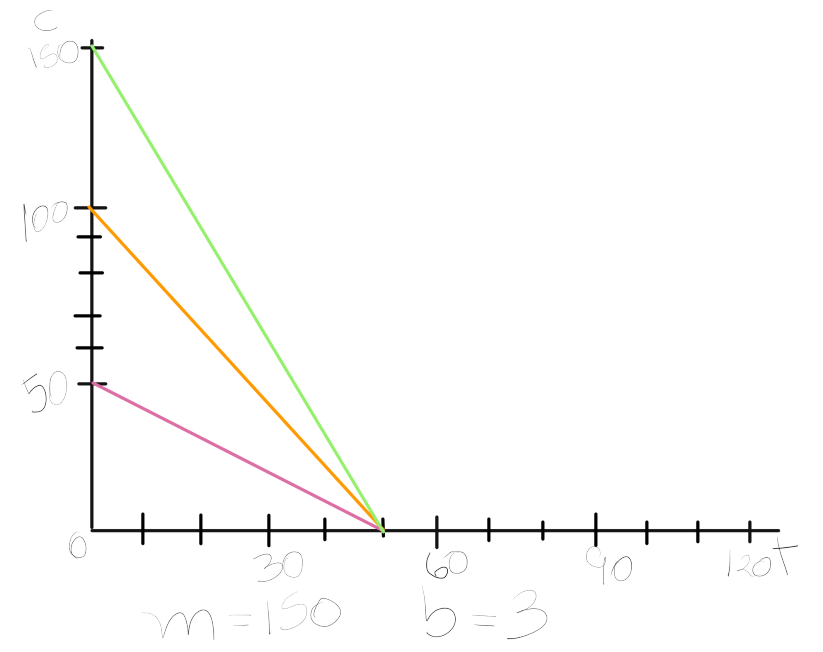
c = 0, m = 150 and b = 3
So:
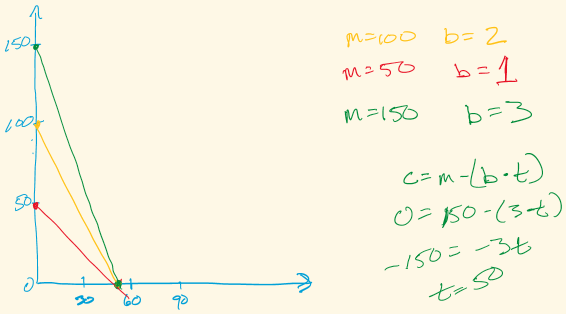
0 = 150 - (3t) => -150 = -3t => -150/-3 = t => t = 50
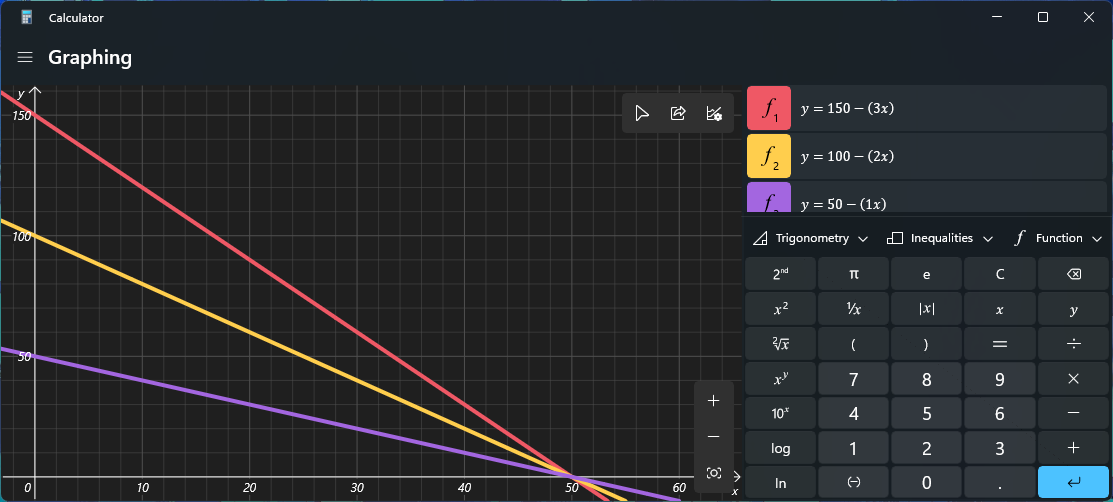
feel like cheating :
I used the built in calculator on Windows 10
The Functions Are As Follows:
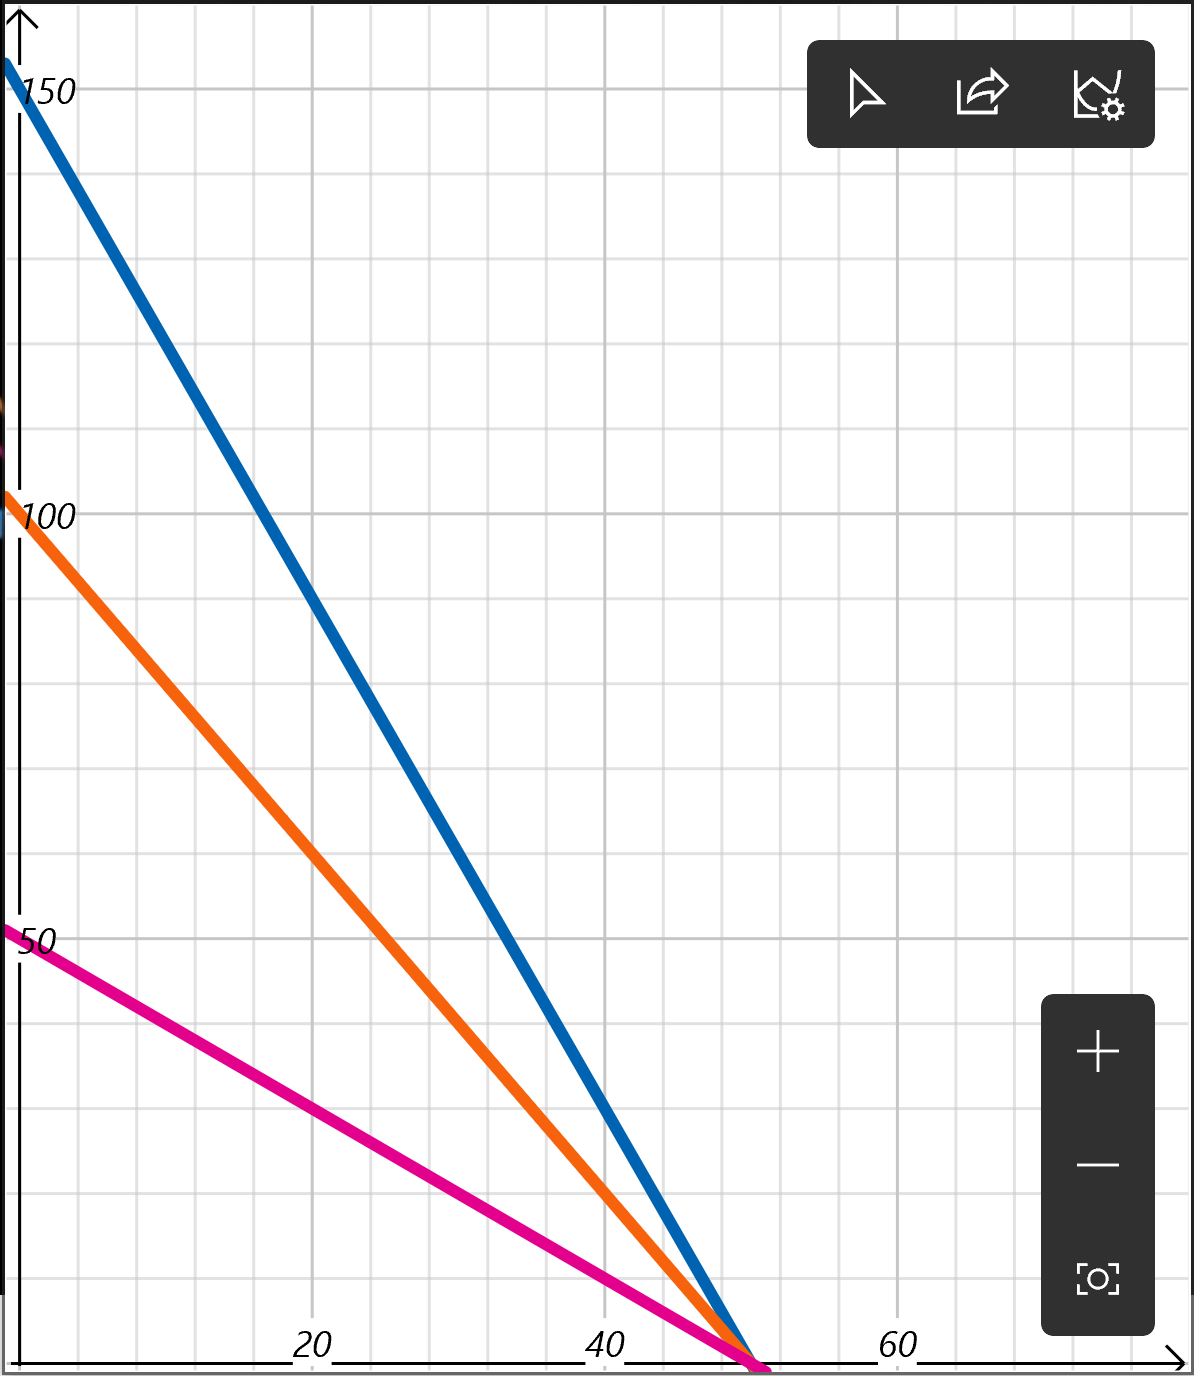
Blue Line: y = 150 - (3x)
Orange Line: y = 100 - (2x)
Pink Line: y = 50 - (1x)
Observations the amounts of maximum fuel given and the rate at which the fuel burns is balance to ensure the fuel runs out at the 50 second mark regardless.
small challenge c=40 at 30 seconds according to graph.
main challenge the green line of 150=m and b=3 starts at 150 on c axis and ends at 50 on t axis
EDIT: Noticed my table header was incorrect. ‘BR 2’ should be ‘BR 3’. Sorry!
0 = 150 - (3xt) evaluates to 50 = t
m = 150 b = 3
c = m - (b x t) =
t = 10 | c = 130
t = 20 | c = 90
t = 30 | c = 60
t = 40 | c = 30
t = 50 | c = 0
answer = t = 50