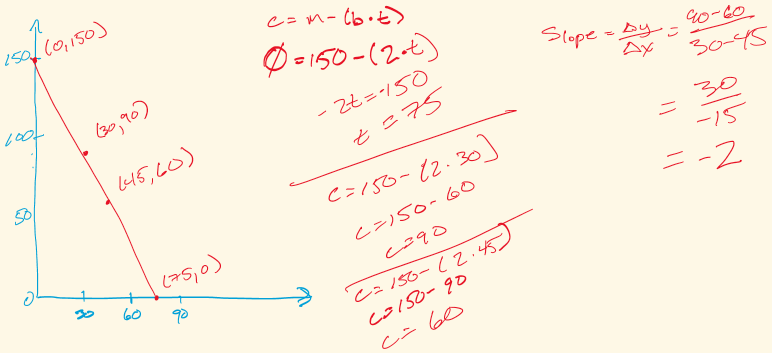
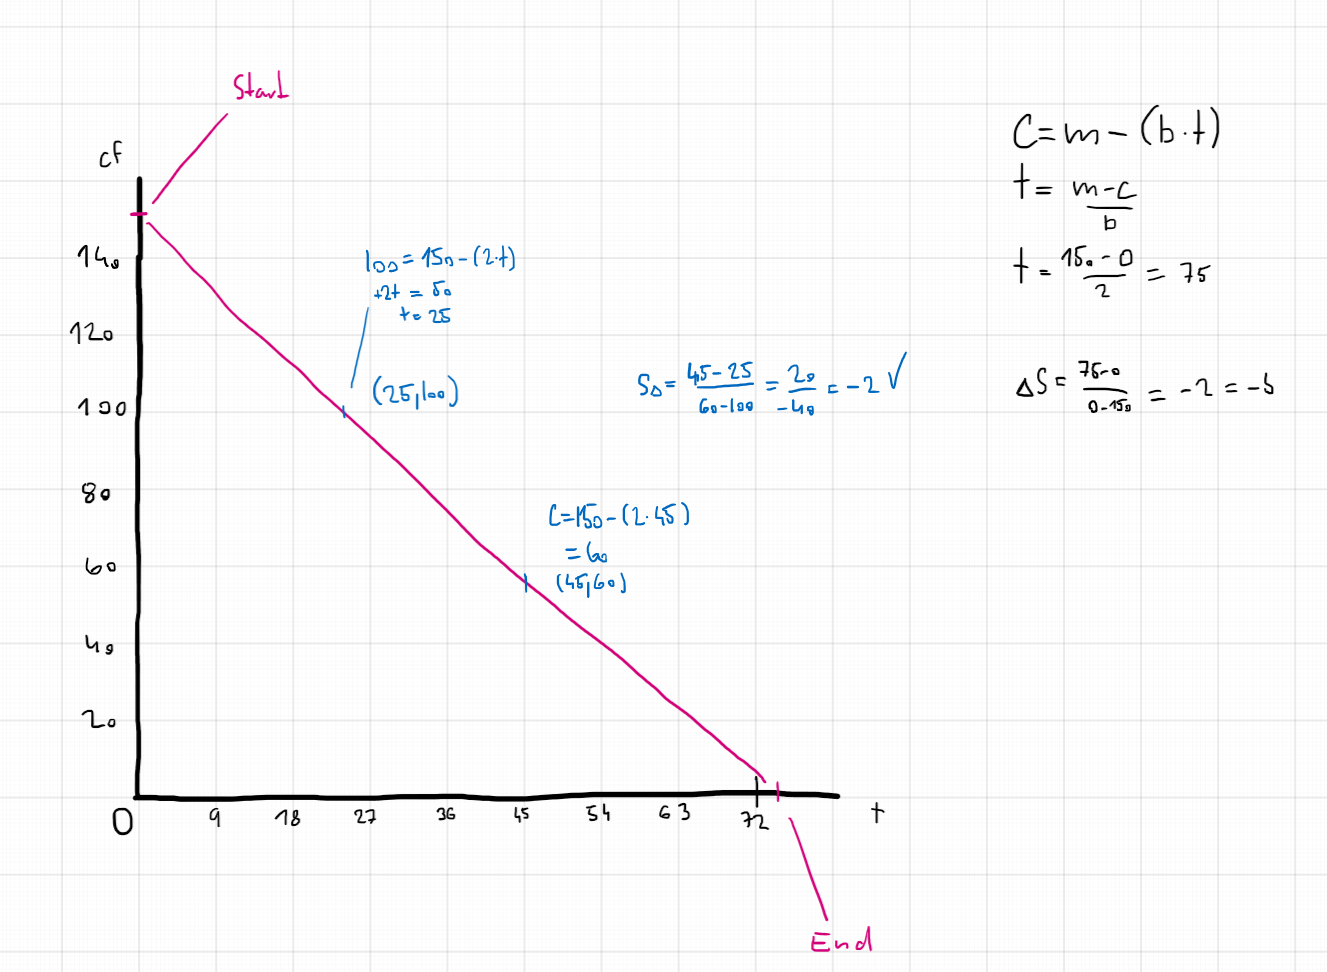
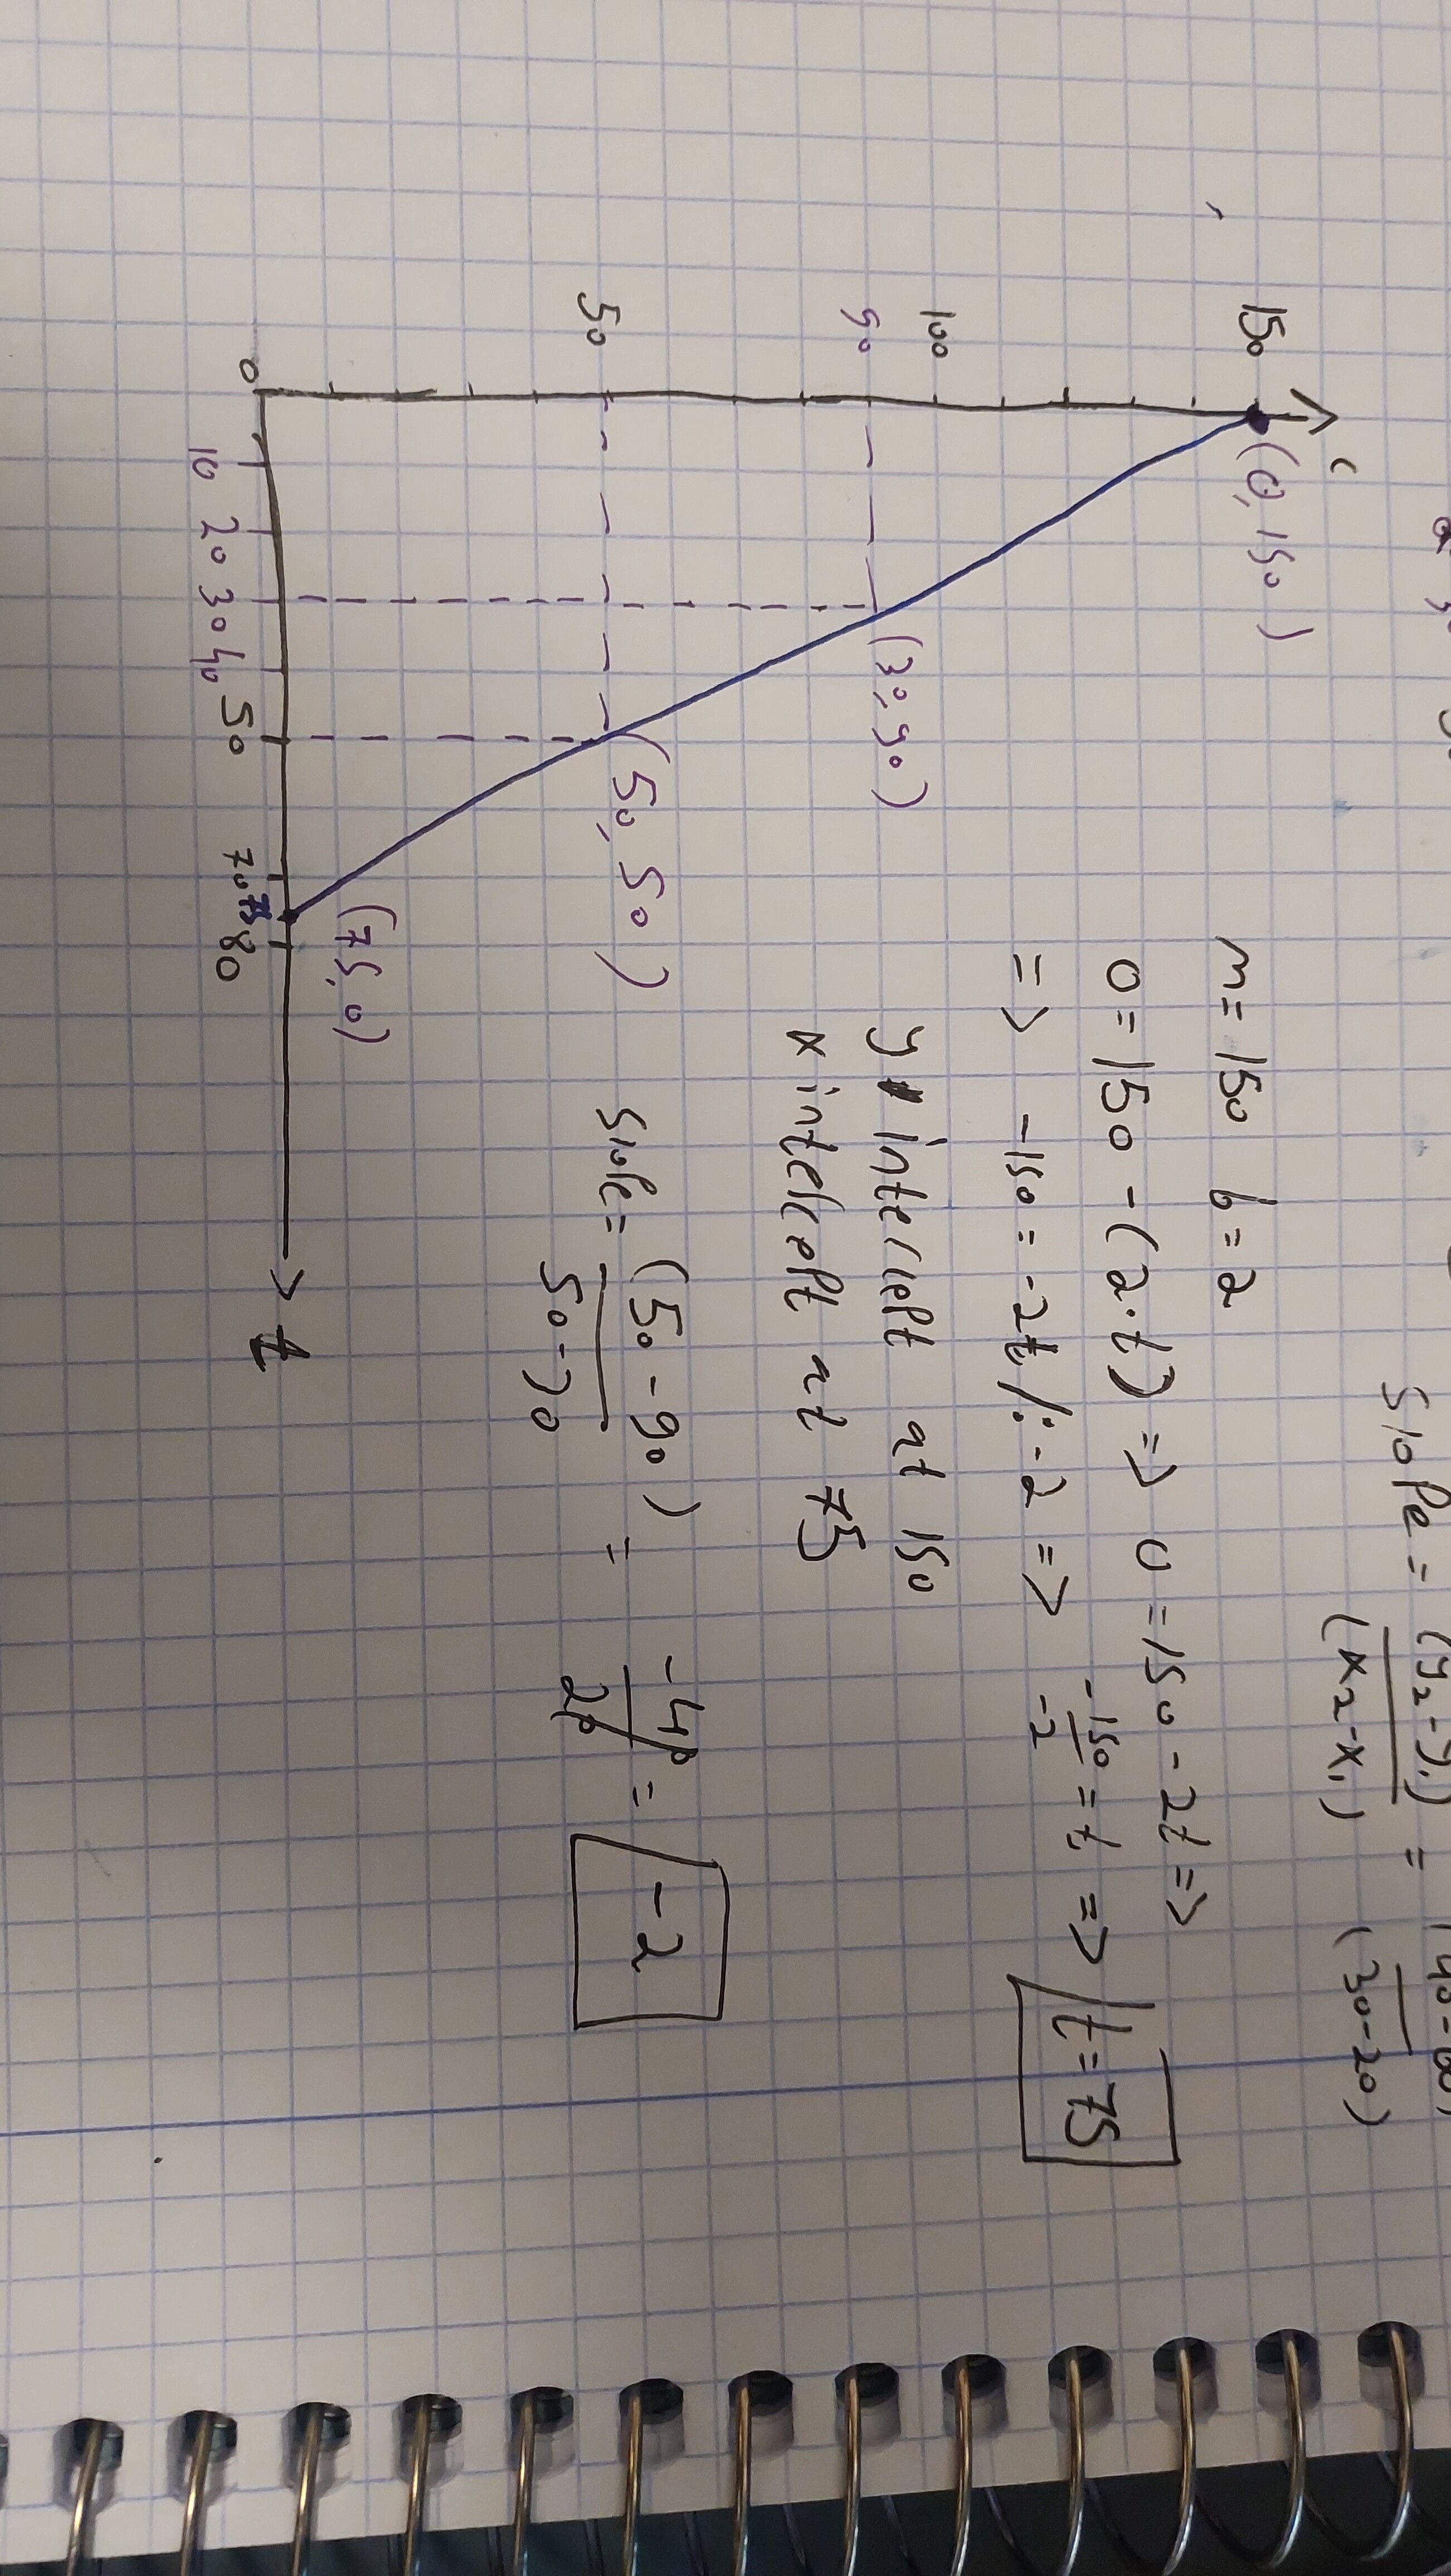
So I found that for maxFuel = 150 and burnRate = 2, the tank lasts 75 seconds.
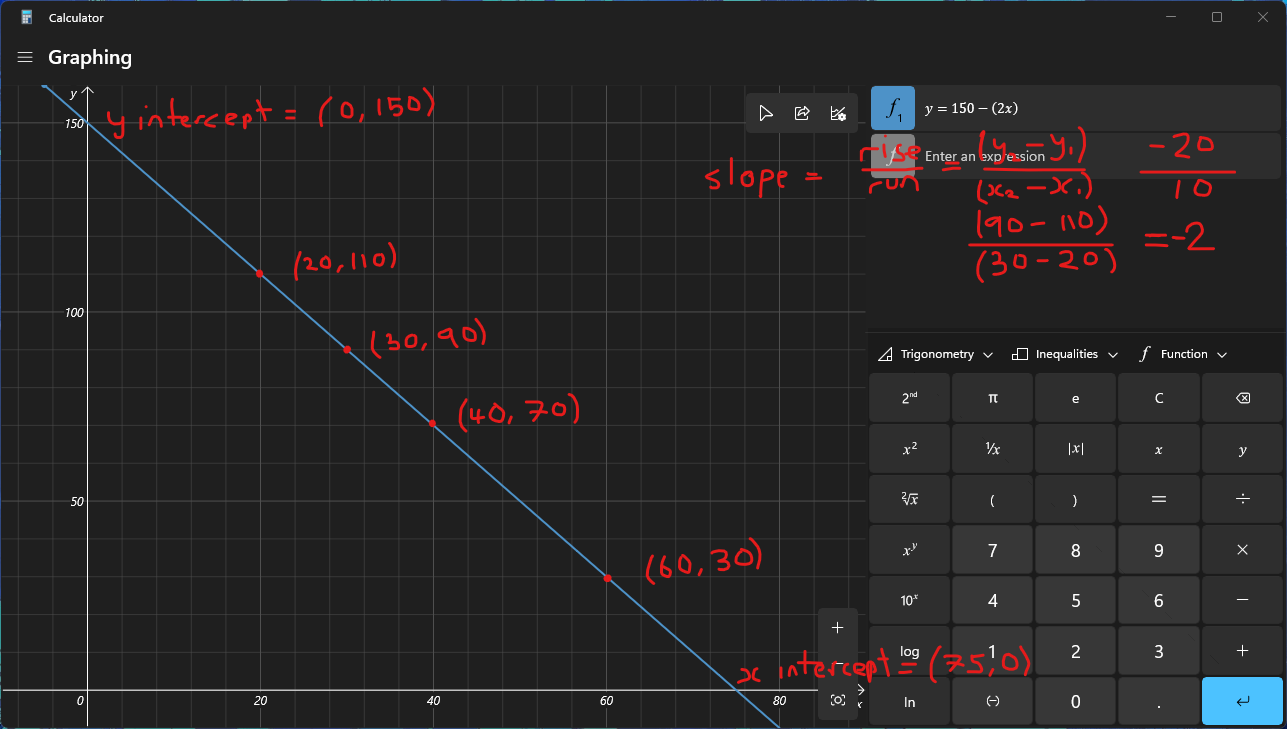
The slope is of -2.
And I have this coordinates: (5,140). (25,100). (50,50). (60,30).
There are no requirement for you to draw your graphs by hand if you don’t want to.
I mainly encourage it at this stage because it can be very easy to rely on technology to do all the work for us and that may not always be an available option when we need it.
However, if you’re already comfortable with reading and drawing graphs then feel free to use a graphing calculator or other digital tools. If you feel like you could use the practice of doing things the old fashioned way then definitely push yourself to give it a go.
It’s really up to you with how you approach your learning, so use whichever workflow you find the most useful.
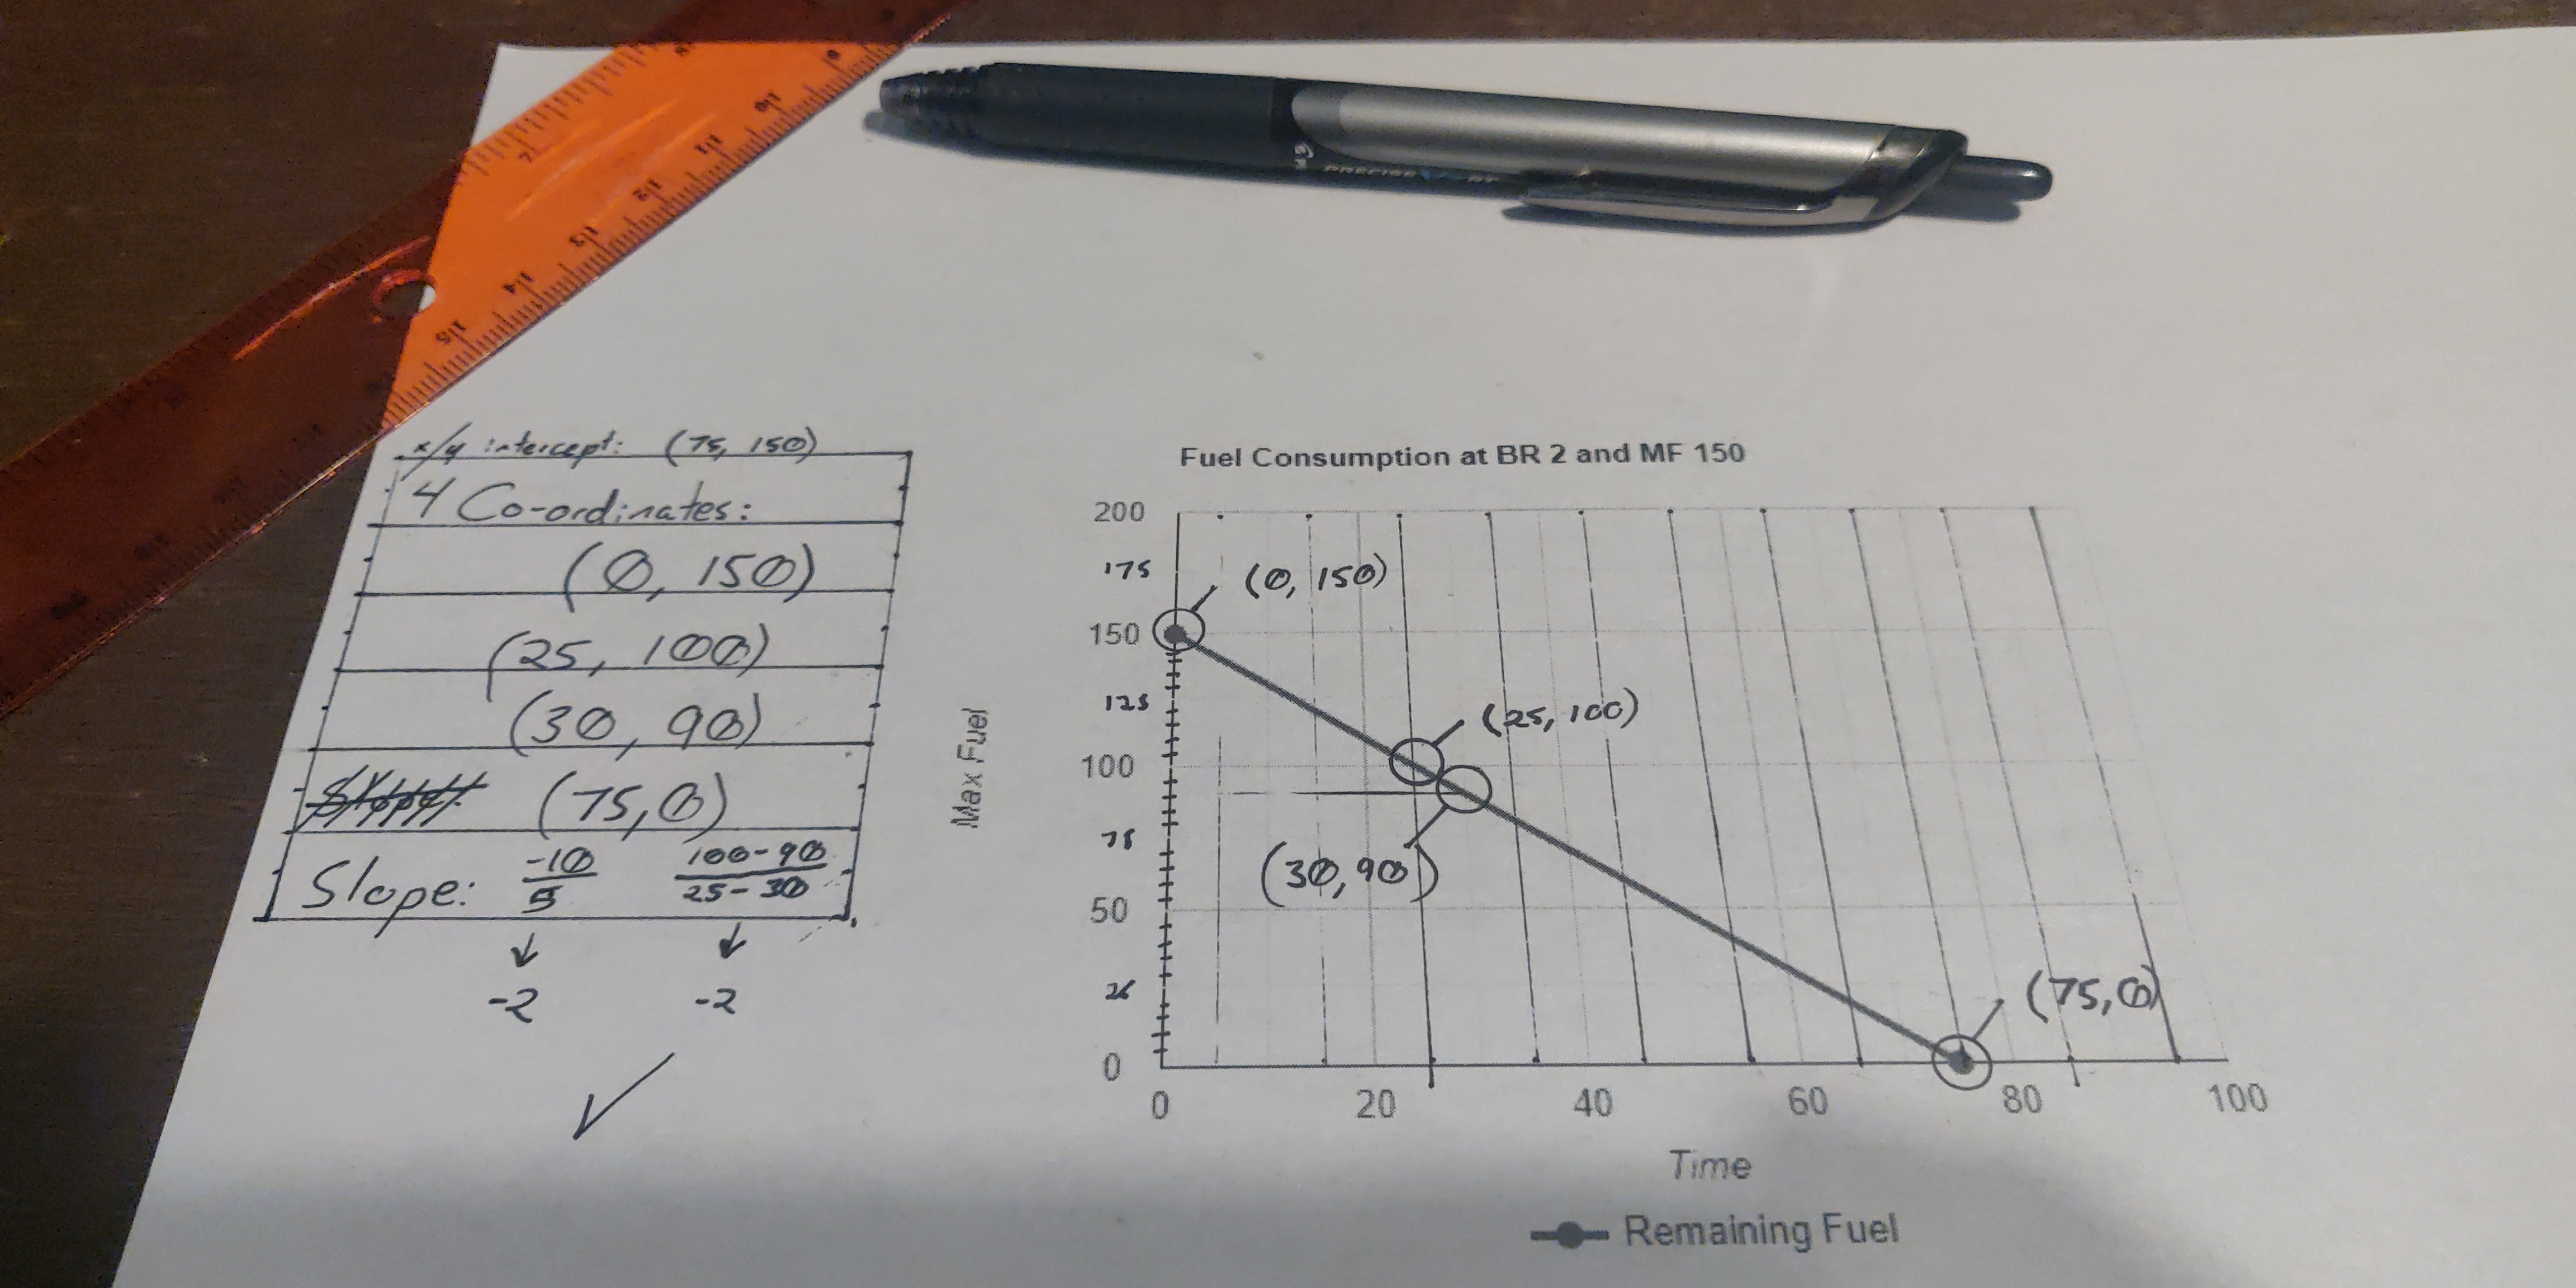
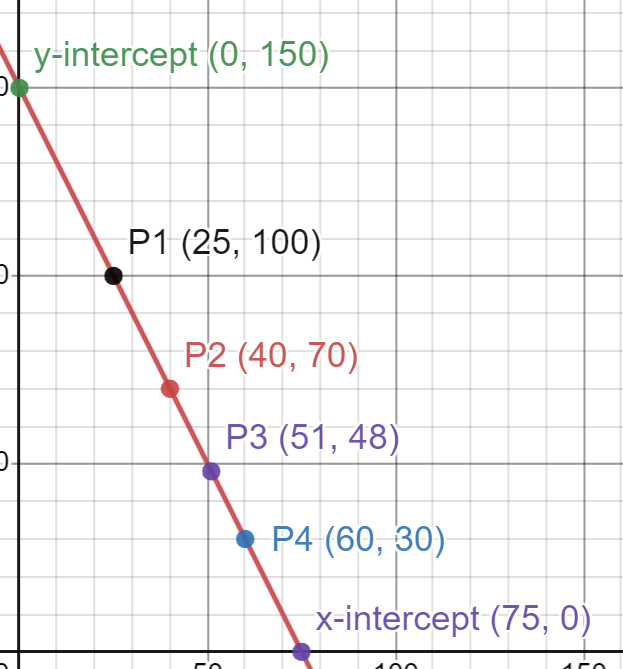
x intercept: (75,0)
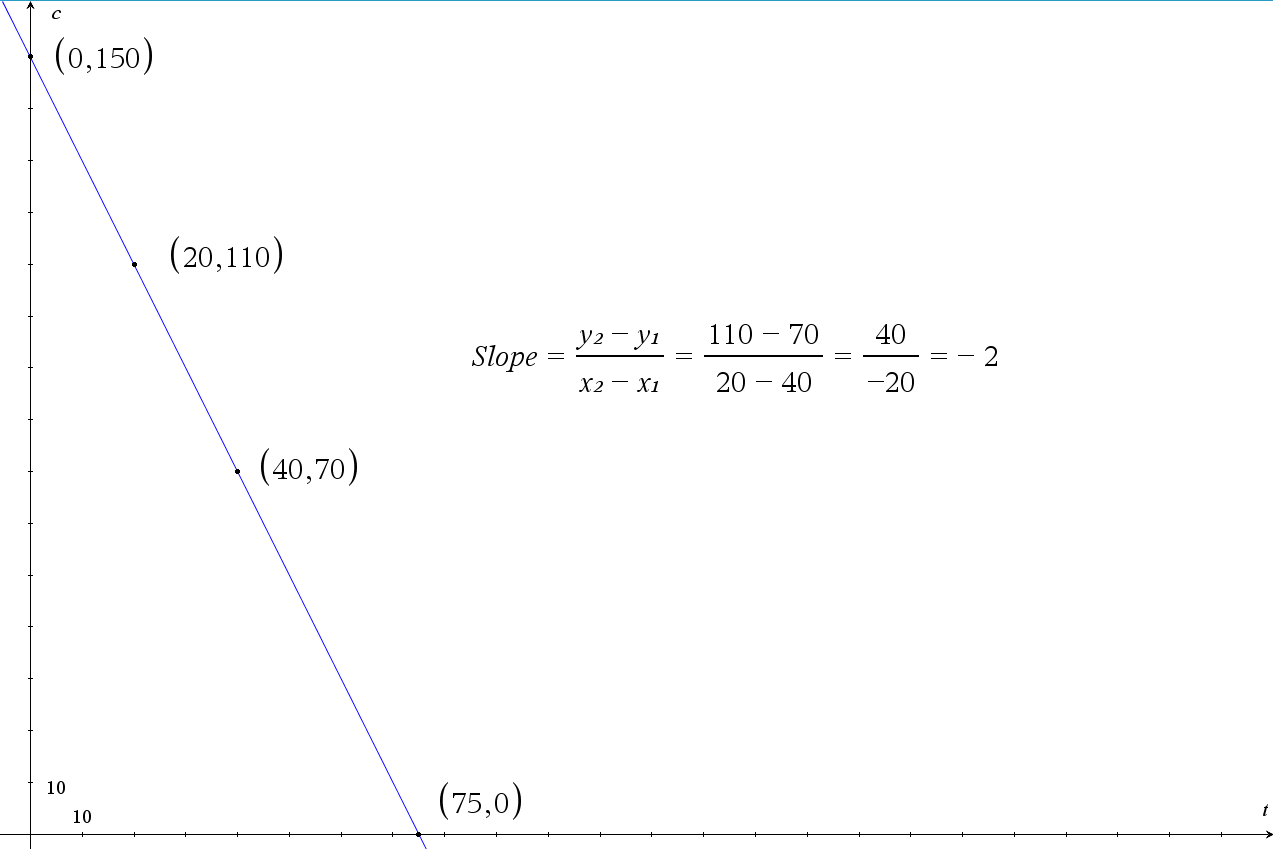
y intercept: (0,150)
Some labeled coordinates: (200,110) (30,90) (40,70) (50,50)
Slope = -2, which makes sense because it is the same as the burn rate.
x intercept is 75 and y intercept is maxFuel (150)
I picked 4 time values for calculating the c and thus the coordinates:
(20,110)
(25,100)
(40,70)
(60,30)
the slope result was -2 or a decay of 2