Math - Exploring Data

In this lecture we organized our data into frequency tables.
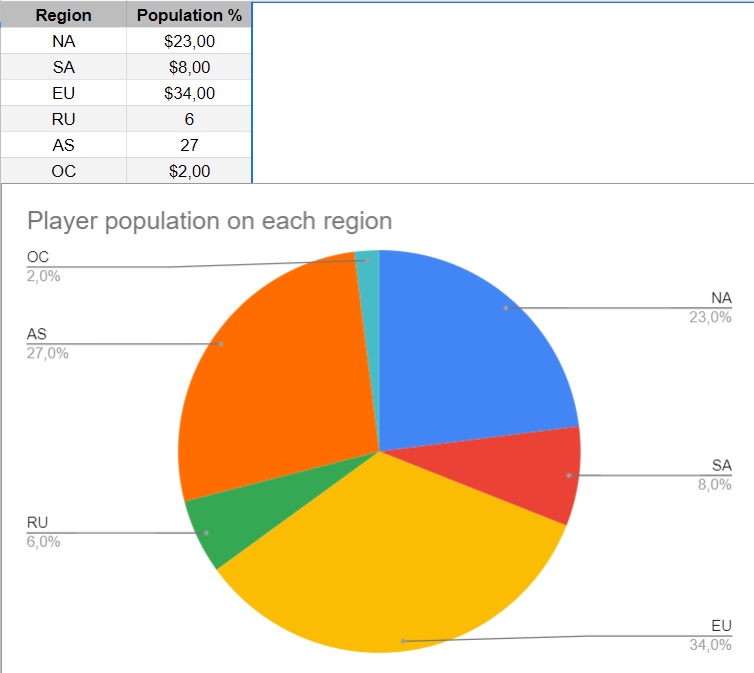
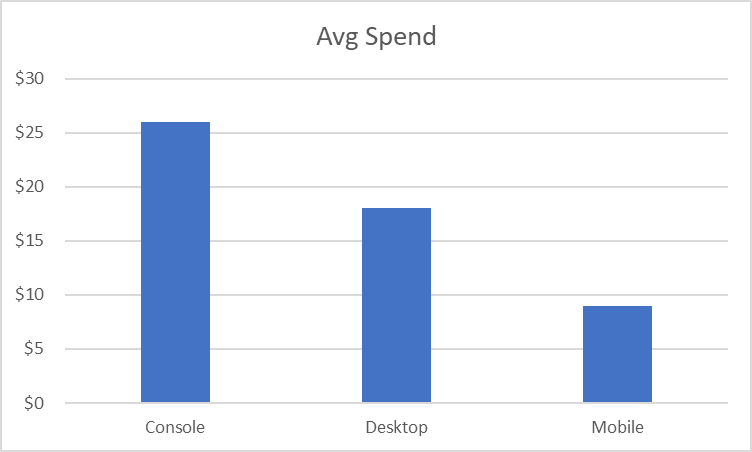
We then looked at how to graph our data using bar and pie charts, and discussed some of the pros and cons of each.

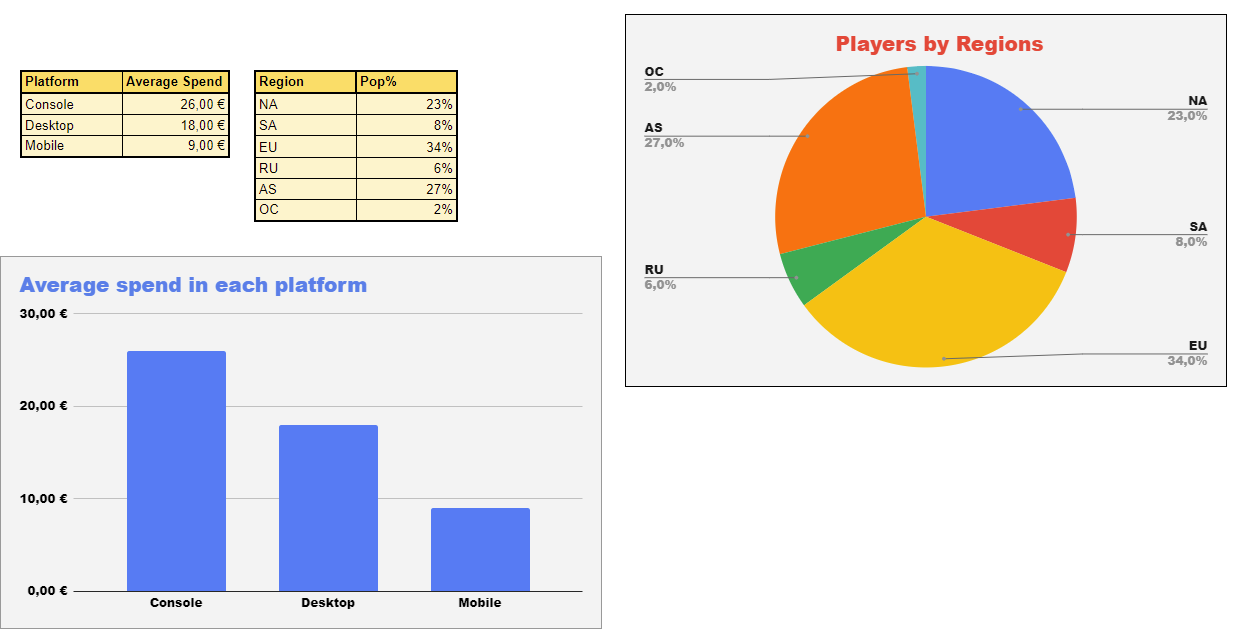
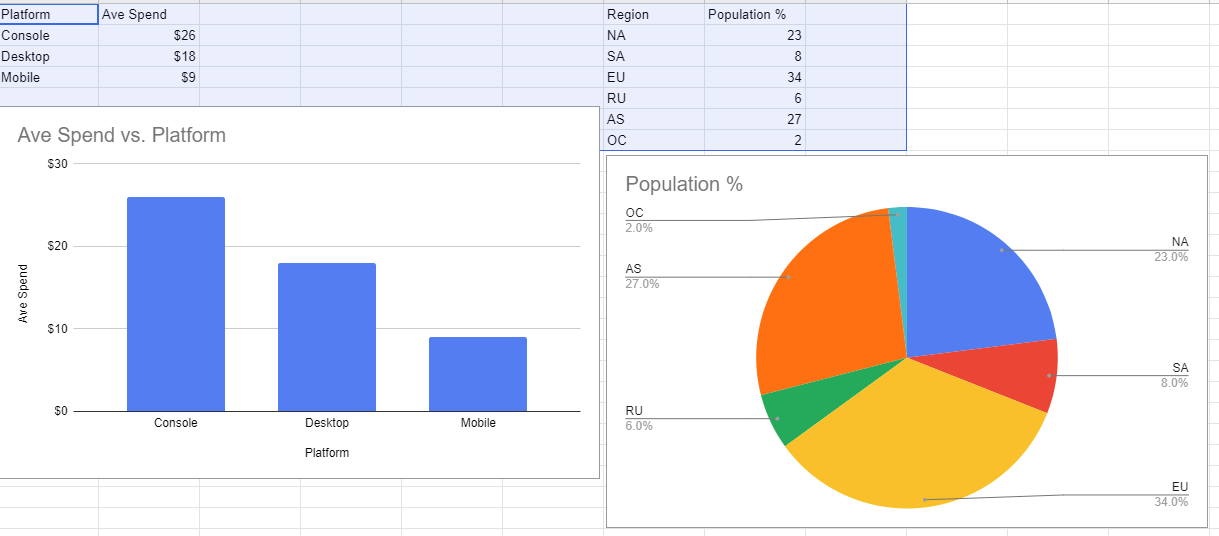
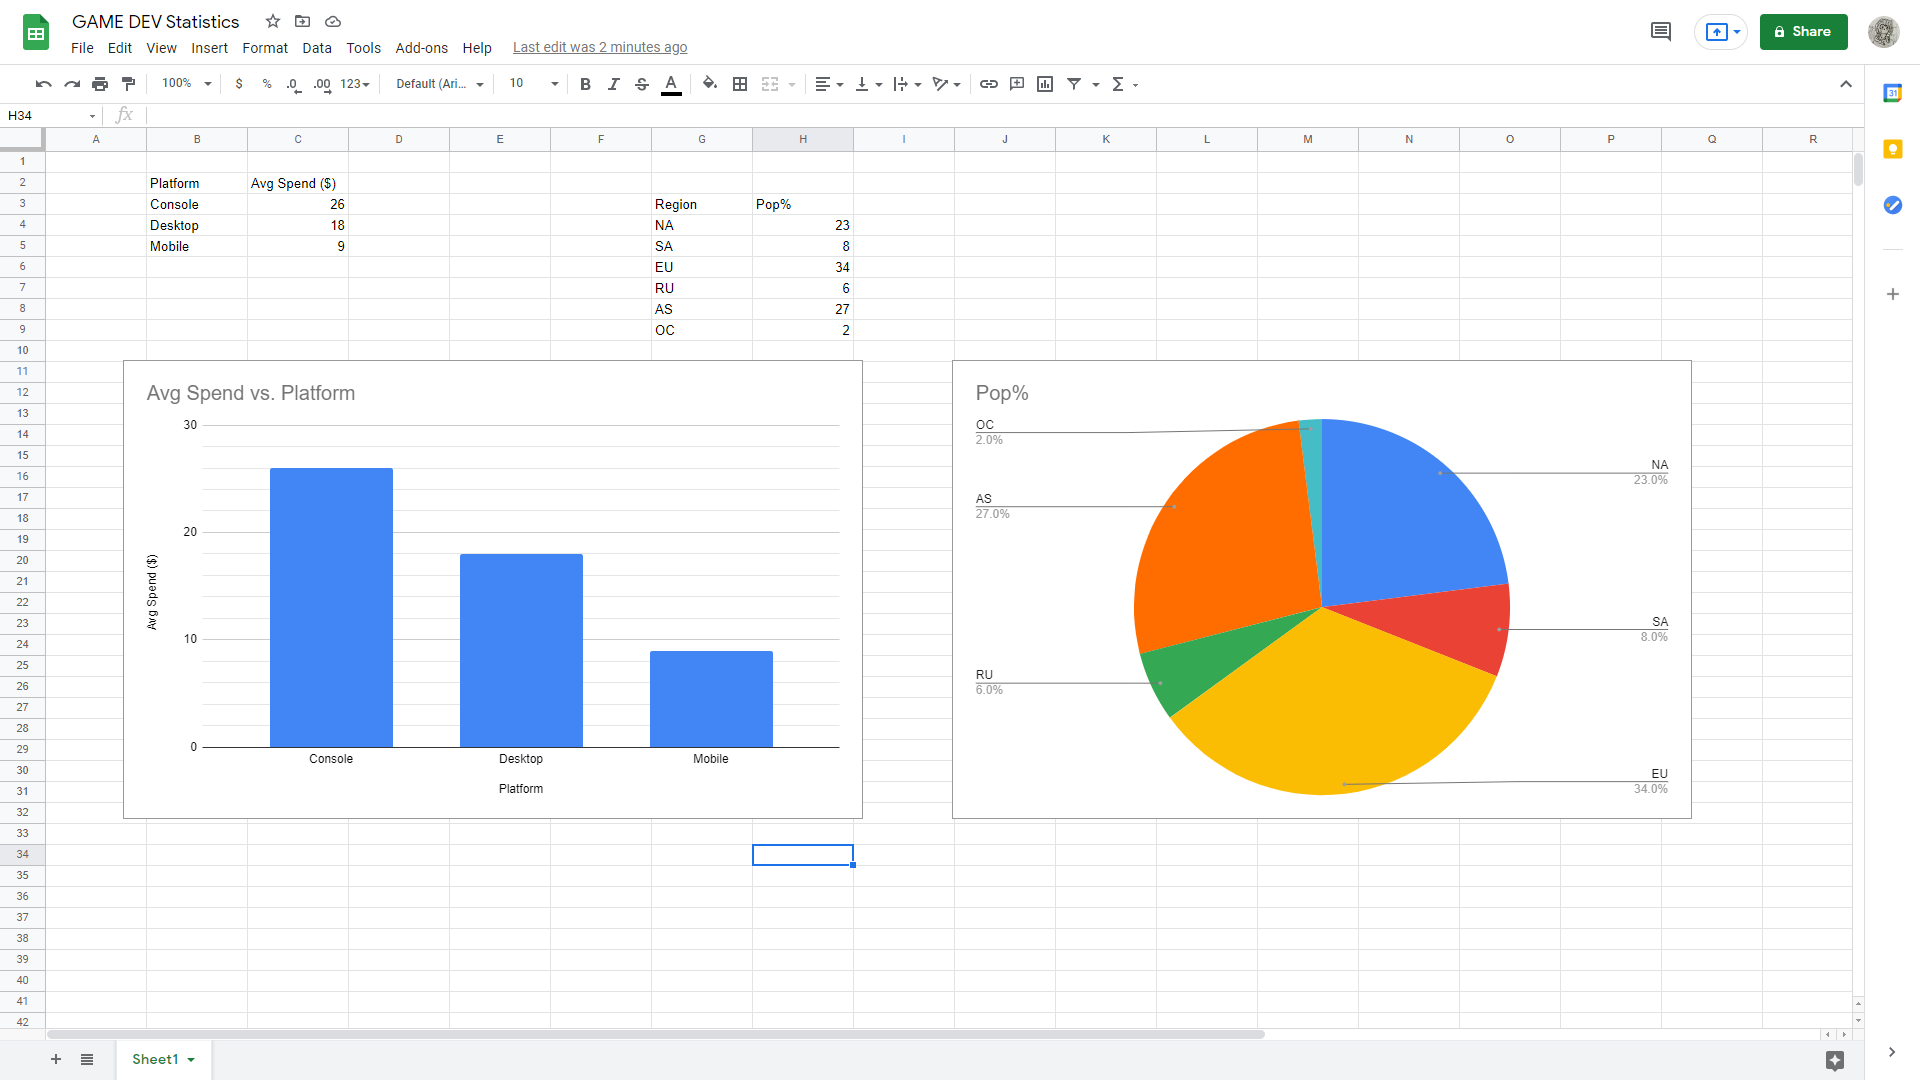
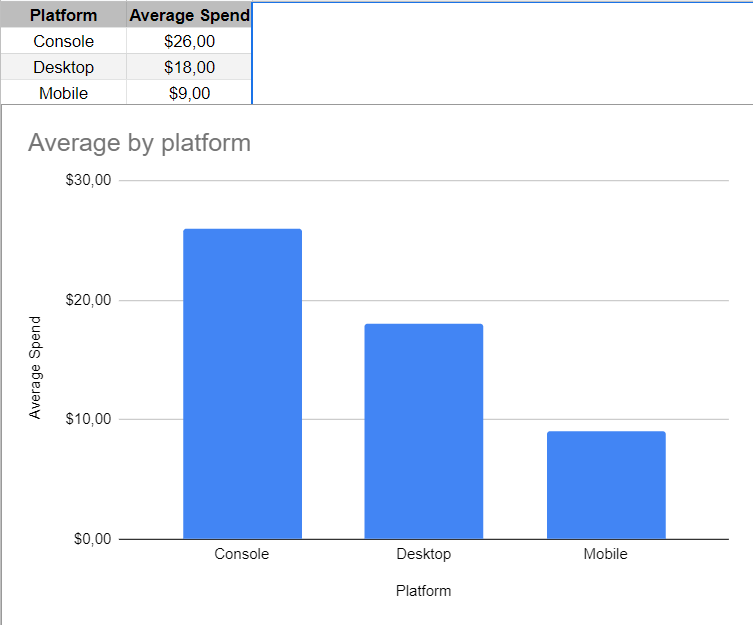
For your challenge you were given two different sets of data and were asked which would be best visualized as a bar chart and which would be best visualized as a pie chart.

Here is the answer, so you can double check your own:

Set A:

Bar Chart - Since this set shows average values that do not add together in any meaningful way, it would not be suitable for a pie chart.
So, in this case, it’s best represented as a bar chart.

Set B:

Pie Chart - This set broke the player base into fractions, so is a perfect candidate for a pie chart.
Of course, you could also represent this as a bar chart to offer a different view of the data.

So we went from managing complex numbers that made my brain melt to bar graphs… :grin:. Im loving the course but that’s quite a change of pace.

@Des_Whittall, think of it as a nice breather after tacking the beasts that are quaternions - Hopefully I managed to demystify them for you!

We do pick up the pace again in the later lectures of this section but we’re working with a very different branch of math so it’s important to take a quick step back to make sure we’re all back on the same page :slight_smile:

Here is my respond for challenge:


These are made in google sheets.

I think the population by regions is better as a pie chart because the percents add up to 100%. Average spend does not add up to anything so it’s better as a bar chart.

1st - Bar
2nd - Pie

1 Like


The first data set is best shown as a bar graph, as its comparing values.
The second is best as a pie chart, as it is percentages out of a whole.

The average spread information is best visualized as a bar chart so that we can tell the difference between spreads we receive on various devices. The population is best as a pie chart to visualize the relative size of the various population groups within the whole.

These are made in MS Excel.

1 Like

Privacy & Terms