Math - Complex Numbers

In this lecture we took our newly discovered imaginary numbers and combined them our real numbers to create the complex plane.

Working with complex numbers is similar to how we work with normal 2D vectors, they’re just written slightly different.
However, understanding them is an important stepping stone on the way to understanding higher dimensional numbers such as quaternions.

In the beginning of the video, you write the formula 3 + 2i. Then, on the real number axis you plot the point 2, and on the imaginary number axis you plot the point 3i. Shouldn’t this be 3 on the real axis and 2i on the lateral axis?

By the way, I am thoroughly enjoying this course! It’s great how each lesson builds on the ones before it. The graphs and other visuals do a great job explaining why these things are the way they are.

Hi @archbishopFPP, it’s great to hear that you’re enjoying the course!

I’ve reviewed the video and the graph looks correct.
The real part is represented on the horizontal axis and the imaginary part is along the vertical axis.

Here’s an image of the graph in question - If I’m looking at the wrong part of the video, please let me know.

In this part, 1’26’’ into the video, the real component is show as 2 and the imaginary component is shown as 3. This might be a mistake, or it may be I’m misunderstanding something about how complex numbers are graphed.

image

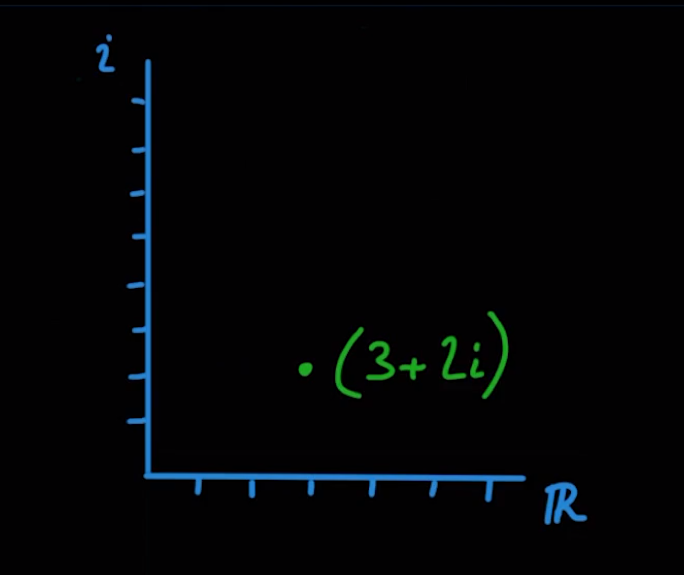
Both axes are extending from zero and the three points shown are completely unrelated examples that are being used to show how you might graph any complex number on the complex plane (including purely real numbers).

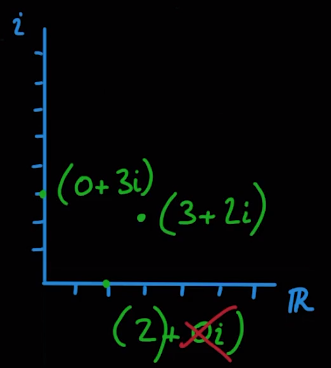
The three points are at:

  • 3 + 2i or (3, 2)
  • 2 + 0i or (2, 0)
  • 0 + 3i or (0, 3)

The two points that are directly on the axes at 2 + 0i and 0 + 3i are there to show how we don’t have to fully specify the complex number if one of the elements is zero.
For example, the number 2 + 0i can be shortened to just 2, since the additional information about the 0i component doesn’t provide us with any useful information - if the component is missing, we know it must be equal to zero.

Here’s an annotate graph to clearly show the labeled axes for the point at 3 + 2i:

Screenshot 2021-02-17 201343

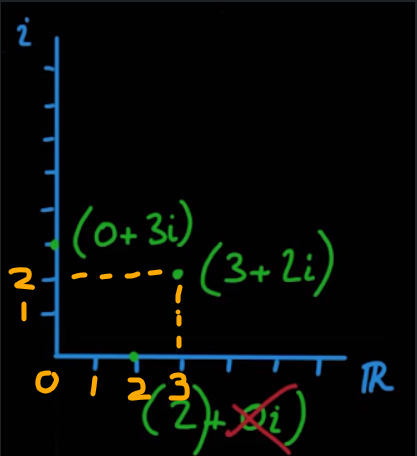
I hope that clears things up for you but, if not, please do let me know.

1 Like

but where does this stuff use? :worried: :worried: :worried:

Privacy & Terms