Hello There!
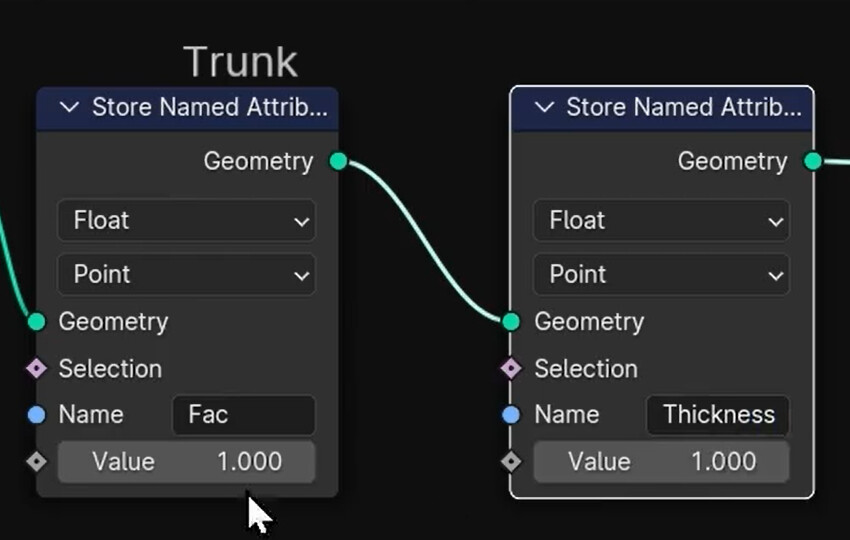
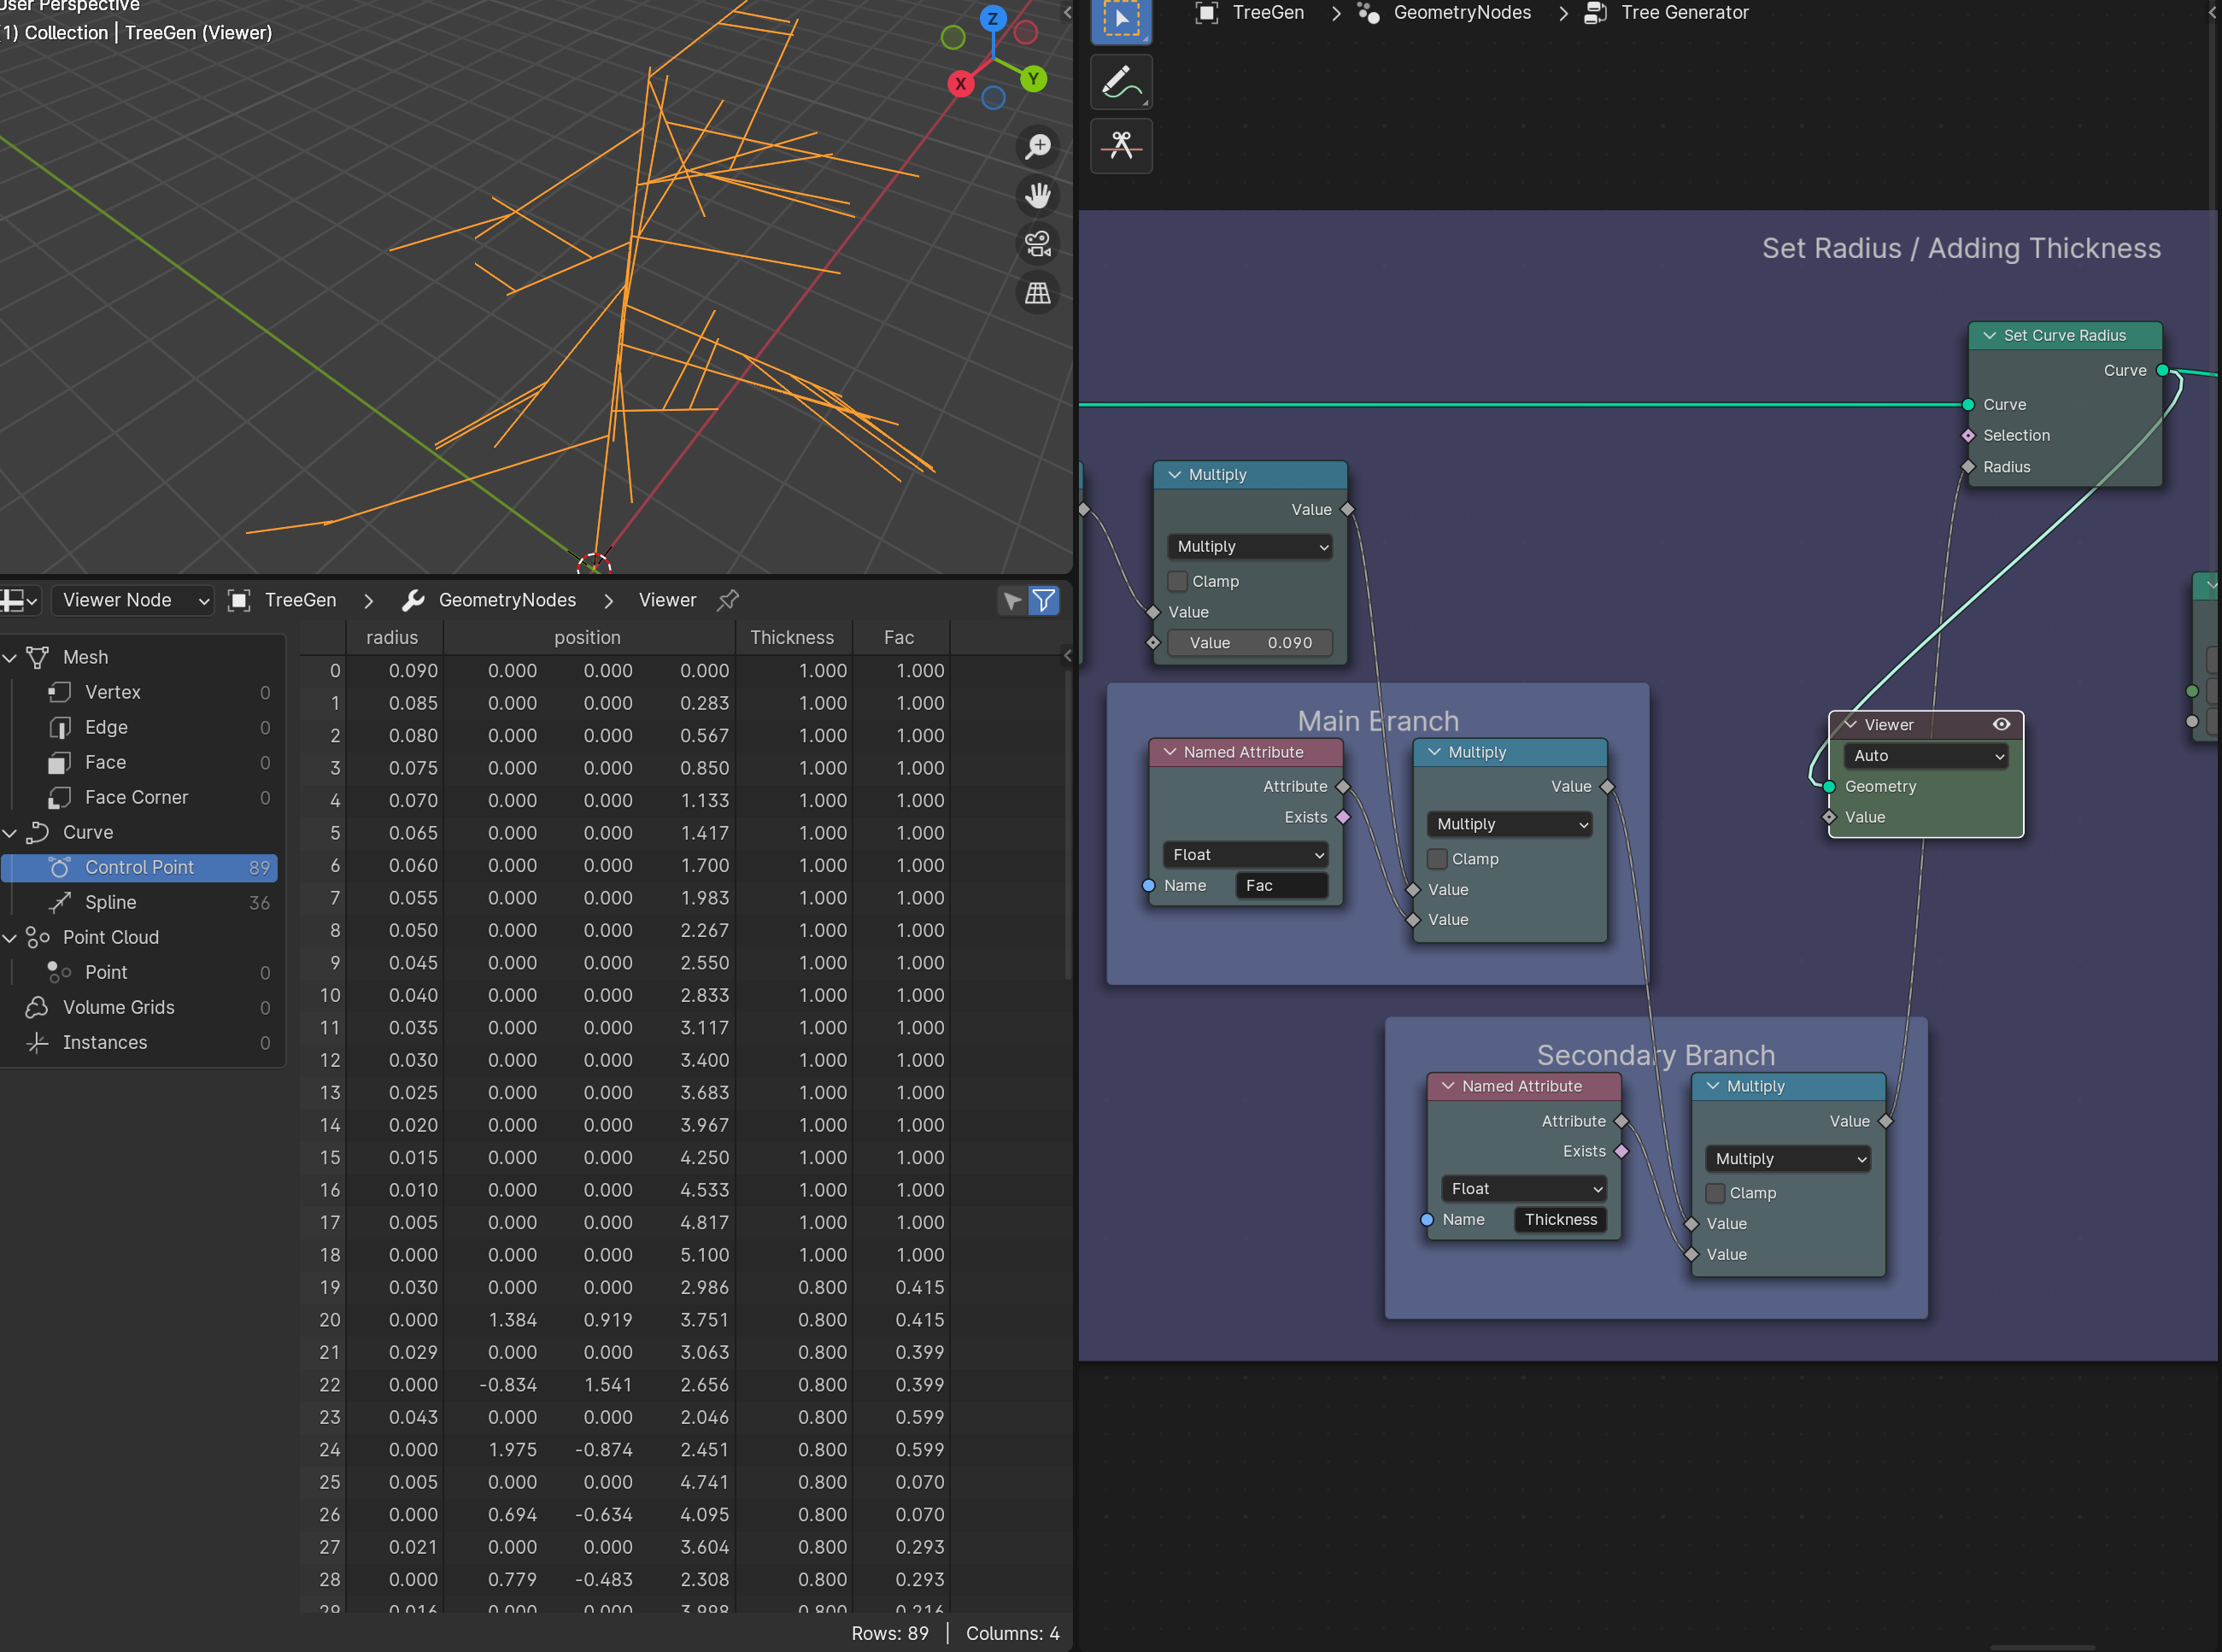
In the Geo Node course, when building the Tree Generator, @StephenWoods solves the issue of the diameters of the secondary branches not matching the main branch diameter by adding a 2nd Stored Named Attributes node.
Ok, good question, how does it work…
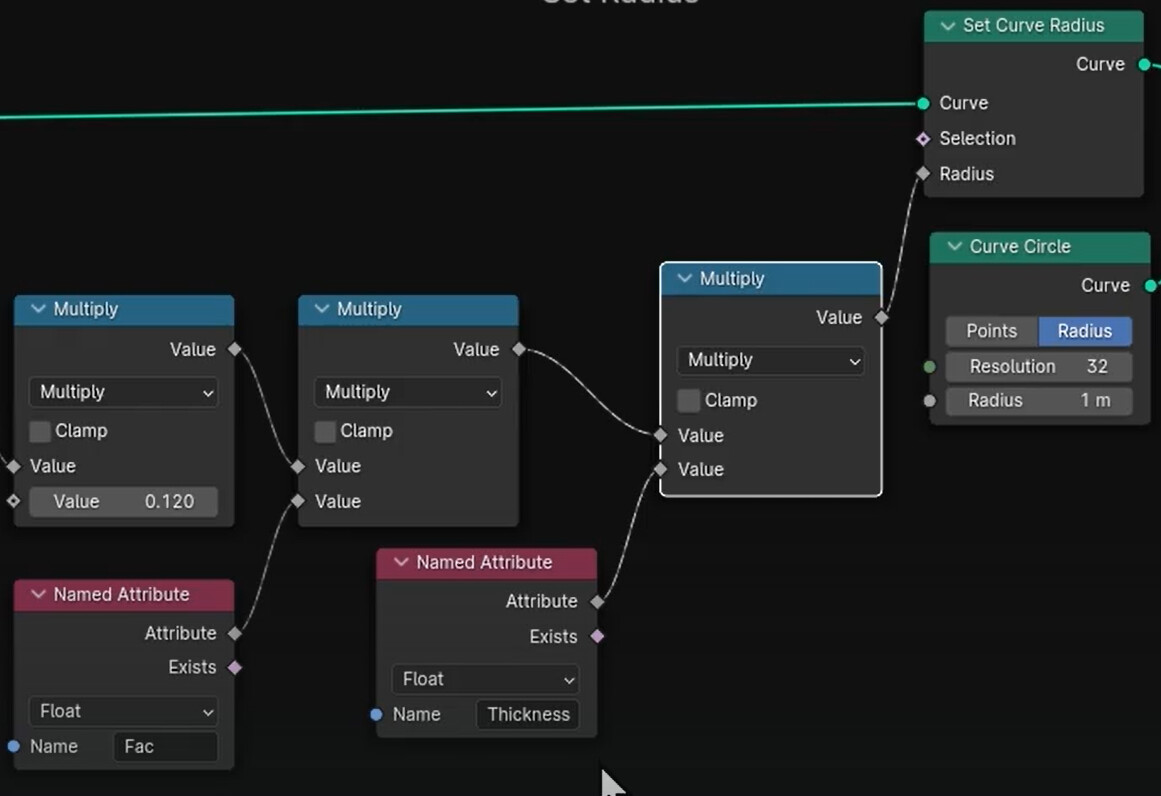
The simplest way to explain it is that every point has a whole bunch of attributes, the most basic and obvious is it’s x, y, z position (where that point is in the scene). But when you add something like a set curve radius, they will get a radius attribute.
Using ‘Store Named Attribute’ lets you add a custom attribute, and assign a value. In this case we assign a value that will later be used to multiply the existing radius attribute.
The attributes you add dont have to be float values, you can store vectors, colors, or basically any of the common datapes.
Cartesian Caramel (https://www.youtube.com/@CartesianCaramel) and Erin Woodford (https://www.youtube.com/@Erindale) both have some really advanced geonodes stuff, they use named attributes a lot. Erin in particular has a lot of helpful reference videos, but the last one on attributes is a couple of years old and the nodes have changed a fair bit since then, but the theory still applies (although you might find some parts a little hard to follow along with due to some depreciated nodes).
As for the spreadsheet, its just a way to see the attributes of each point cloud, instance, mesh etc. It cant be edited itself, its just a readout of whatever your geonnodes output is. It can be useful to debug your node tree, or see what values are being held where, the number of points, meshes, instance etc. But honestly, 99% of the time, I dont look at it.
In fact, outside geonodes, when you are just modelling, all that data also has attributes, there just isn’t a spreadsheet you have access to. But if you select the default cube, you can see its position, rotation, scale etc. In edit mode, you can select a vert and see its position data. Its just that you change the position data using a gizmo or ‘G’ and you only see the change in the viewport. In Geonodes, we add a ‘Set Position’, and we can see it visually in the viewport and in the spreadsheet.
I hope that helps.
Hello Stephen,
Thank you for your reply. This is great and provides me with good starting points. +1
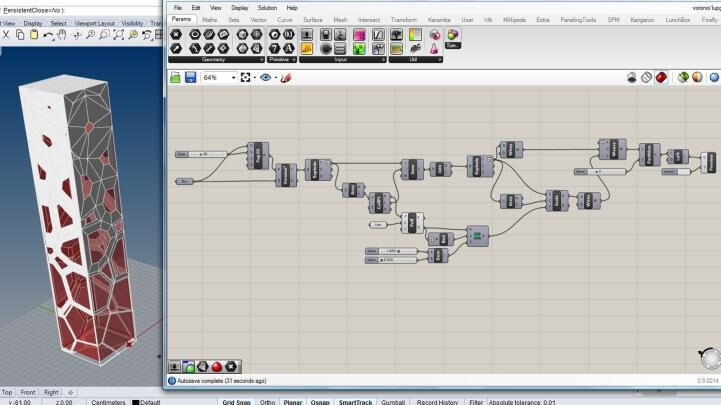
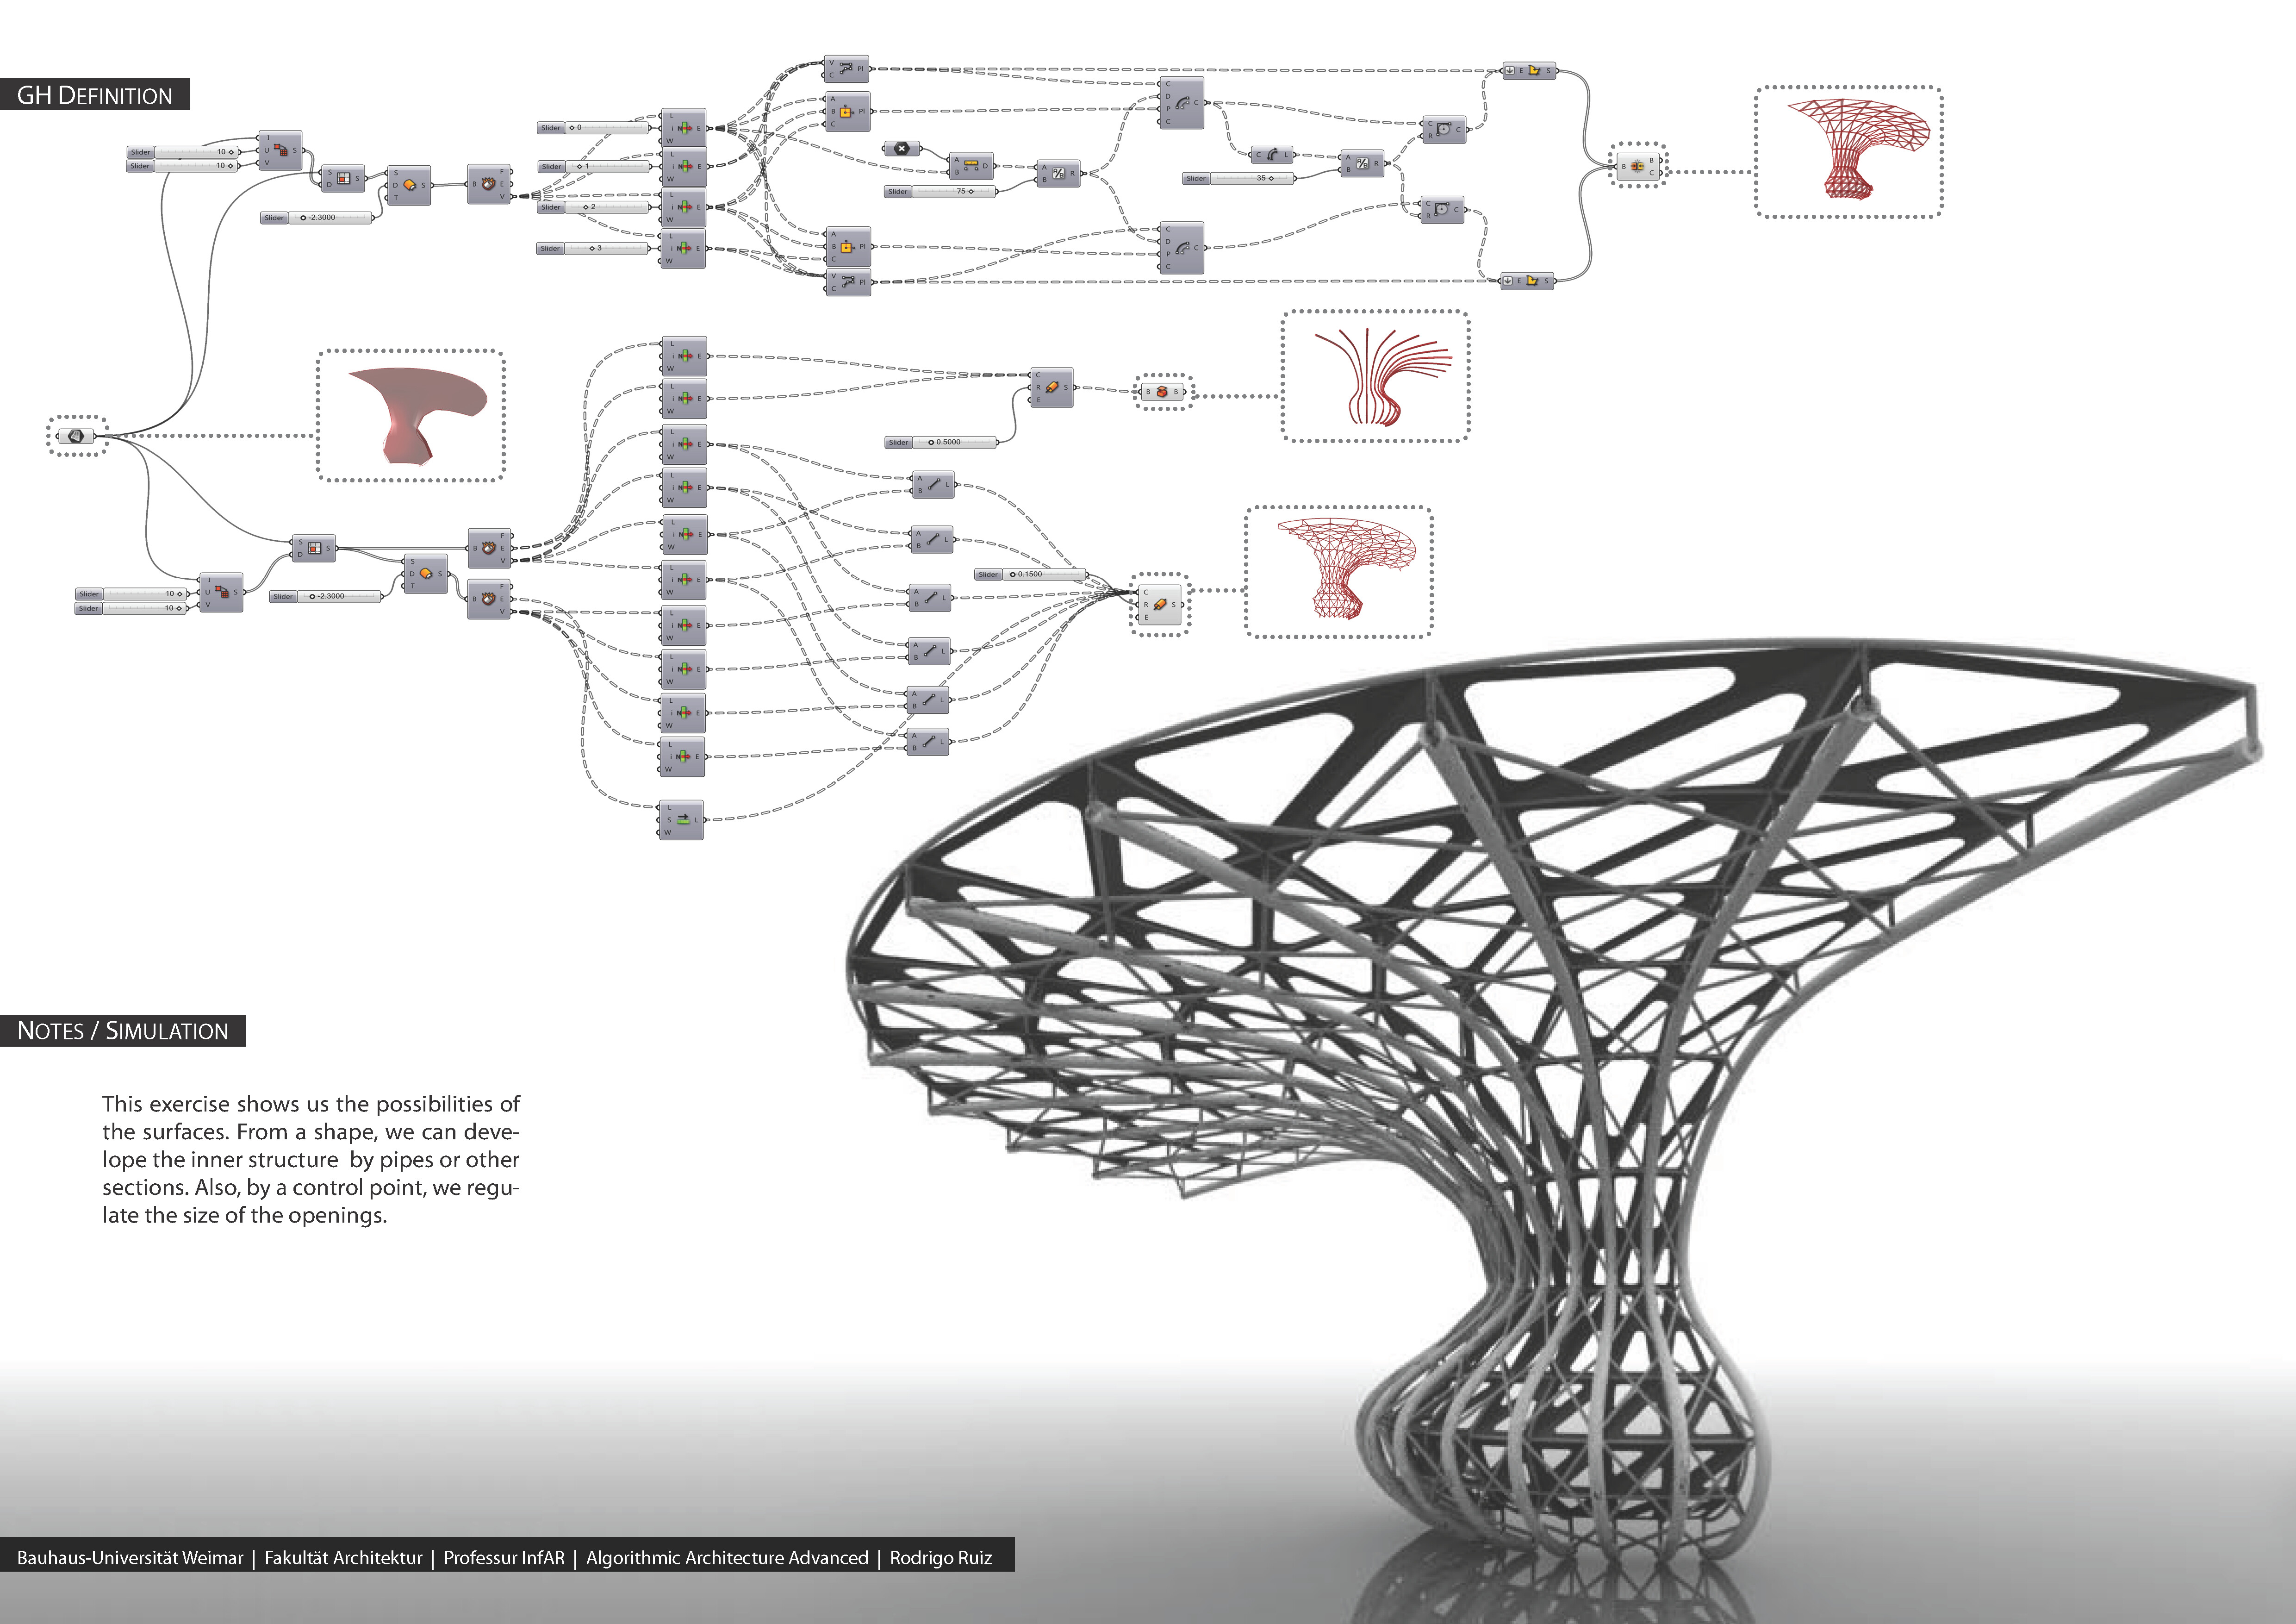
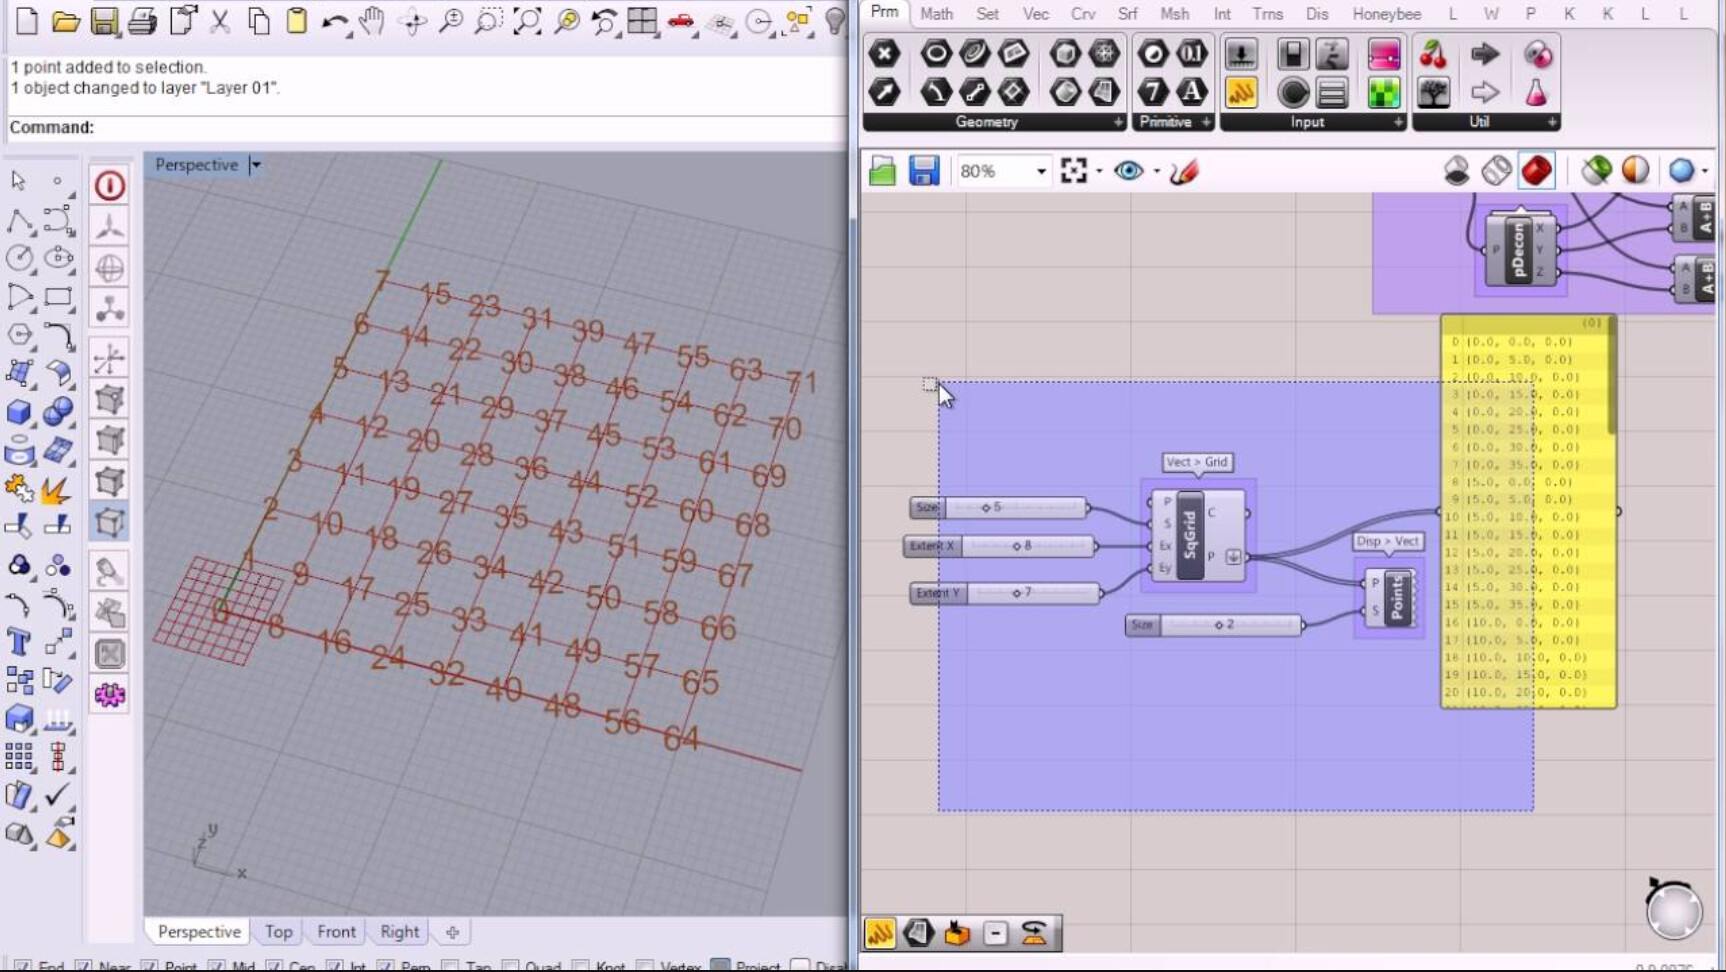
Some background, I’m using Rhino + Grasshopper since ~20 years, which is node-based too.
What I like about Grasshopper is the easy access to and how to manipulate data. And the logic behind the data and how Grashopper handles it is very well described.