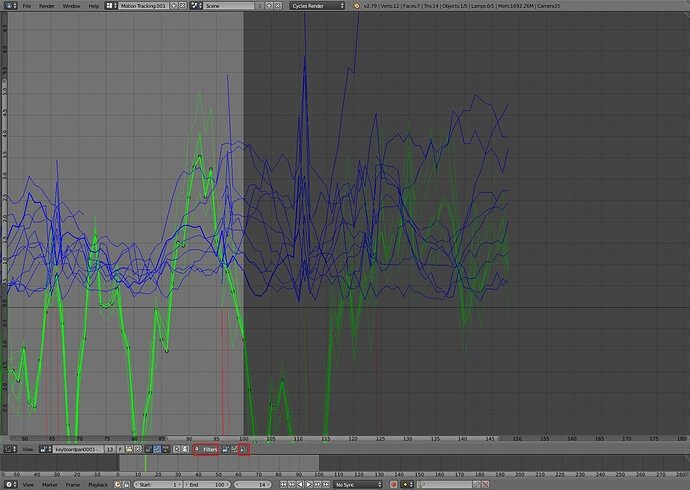
The graph in motion tracking shows x-velocity (red) of each tracking point (track), y-velocity of each tracking point and, by default, the average tracking error of all tracking points. If, like me, you’re struggling to figure out where your errors are, then you can display tracking error per tracking point by clicking “Filters” and then the squiggly arrow. Then you can click on the tracking markers and the relevant error bar will be bolded.

